Advanced Analytics Early Access
IMPORTANT
Early Access for Advanced Analytics is available only to customers who meet specific criteria. For more information about the Early Access program, contact your Infobip account manager.
Conversations analytics provide supervisors with an overview and insight into their contact center by diving deep into Queues, Channels, Conversations, and Tags agents use for each conversation. This is the central place where you will find extensive information on different updates and how to create custom reports that best suit your business needs.
Depending on your Conversations package, the following Analytics features are available:
|
Feature |
Start/Starter Package |
Grow/Enterprise Package |
Scale Package |
|---|---|---|---|
| Predefined dashboards |
Overview Agents Conversations Voice of the customer |
Right now Overview Agents Conversations Voice of the customer |
Right now Overview Agents Conversations Voice of the customer |
| Custom dashboards | No | No |
Insights Custom dashboard |
| Explore from here | No | No | Yes |
| Alerts | No | No | Yes |
| Export | No | Yes | Yes |
| Data refresh rate | 24 hours | 8 hours | 2 hours |
To view analytics and reports, go to Conversations → and in the drop-down, select Analytics.
Right now
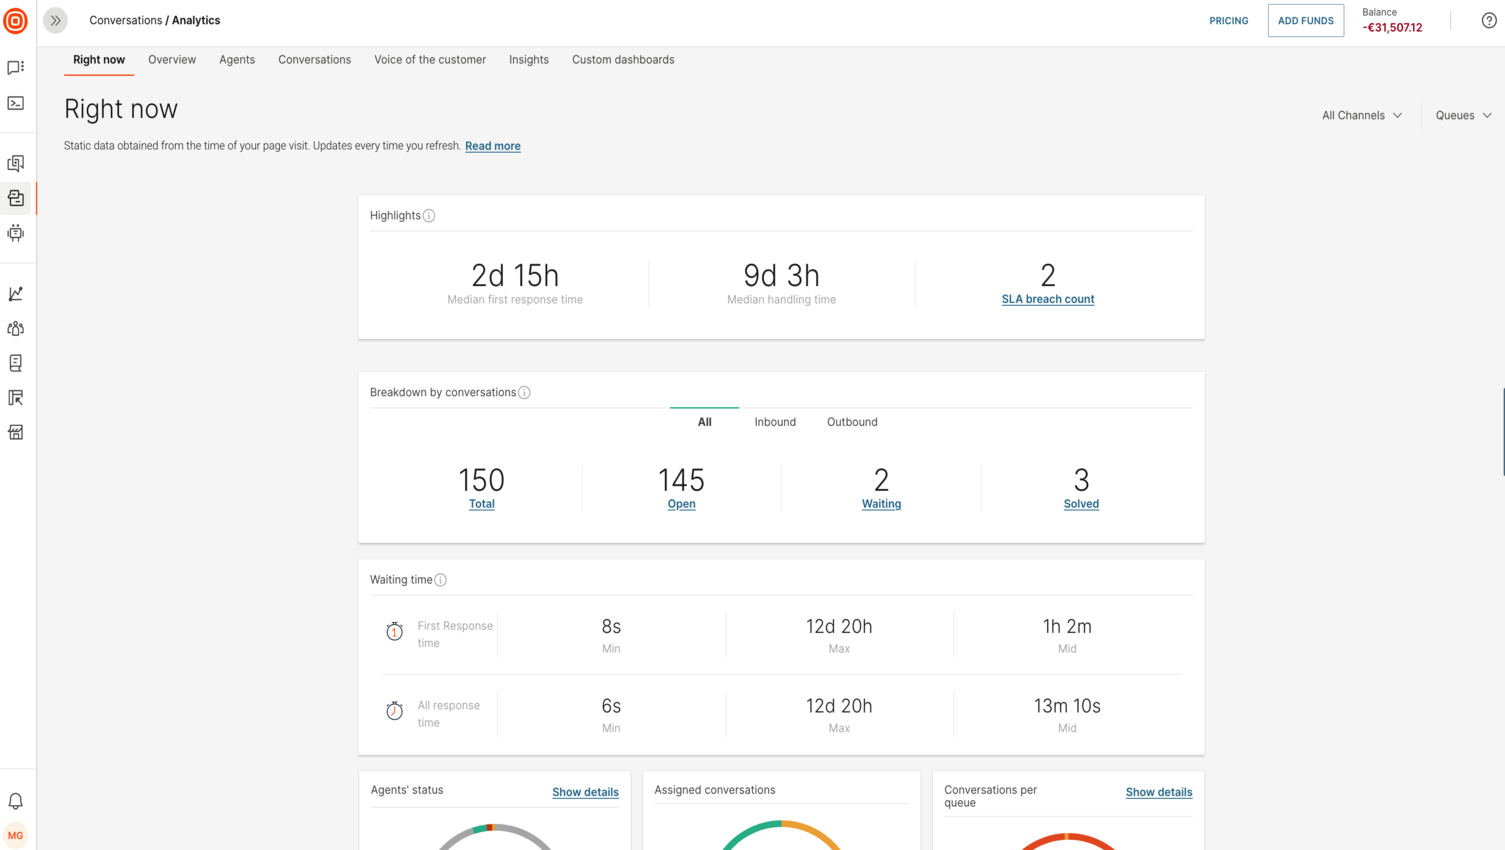
Right Now dashboard communicates the current state of the Conversations contact center. All important indicators are consolidated in one place giving you a clear picture of all current events in your contact center. On the far right side, you can filter per channels and queues, depending on the analytics you wish to see.

Note that this data updates every time you refresh the page to show the most up-to-date analytics.
Highlights
This section shows the current active conversations status distribution and the performance of all queues. It also shows the number of active conversations with a service-level agreement (SLA) breach.
Breakdown by conversations
This insight shows how many active conversations are in each status (Total, Open, Waiting, Solved) with the ability to filter by origin (all, inbound, or outbound).
Waiting time
Allows you to put yourself in your customer’s shoes and see how long they are waiting for your services. You can filter results by selecting a specific channel from the channels list (located in the upper right corner).
These are the metrics that you can find in this insight:
- First response time – The time an agent has taken to respond to a conversation. Measured from the moment a conversation is created until the agent sends their first message.
- All response time – Median time that an agent has taken to respond to all messages (the first message excluded).
Both metrics show minimum, maximum, and median values for each metric.
Agent status
Shows the number of currently logged-in agents versus the number of all agents. The metric also shows agents per status (Active, Busy, Away, and Offline). Click Show details to view all agents. This insight also allows you to export the full list of agents (click the Export mini window and then select the .CSV button in the dropdown).
Assigned conversations
Shows all currently active conversations. It further expands on the number of Unassigned and Assigned conversations.
Conversations per queue
Shows the total number of conversations distributed between statuses per single queue. Click Show details to view more details.
Top most used tags
This insight shows the most used tags in currently active conversations. You will see a ranking system based on the number of times a certain tag has been used. Click Show details to see how each tag is performing. You can also export this list in a .CSV file.
Performance per channel
Shows how currently active conversations are distributed per status for each channel.

Predefined dashboards
The dashboards below showcase the most common metrics that are considered industry standards. These analytics help supervisors and analytics managers to make data-driven decisions while handling their day-to-day challenges in the contact center.
You can also create Custom dashboards, which we cover further in the documentation.
NOTE
The filtering options always stay visible as you scroll down or up any of the analytics tabs. Make sure to glance at them to confirm that you have selected the desired options.
Overview
The most important KPIs and performance metrics of your helpdesk are shown here. Supervisors and Conversations Analytics Managers can get a glance into what is going on with their contact center for the selected period.
You can filter this overview by several parameters:
- Date range (choose between daily - 7 days is the least you can filter by, monthly, quarterly, yearly or even all-time analytics)
- Channel Name (choose if you want all channels or select the specific ones)
- Conversation Queue (choose which queue you want to see analytics for, or select all)
- Conversation Tag (filter per specific conversations tags)
- Conversation Form (see how conversations are performing per specific forms your agents are using)
Use this section to analyze each insight or navigate to other dashboards and get to the root of the current issues in your contact center.

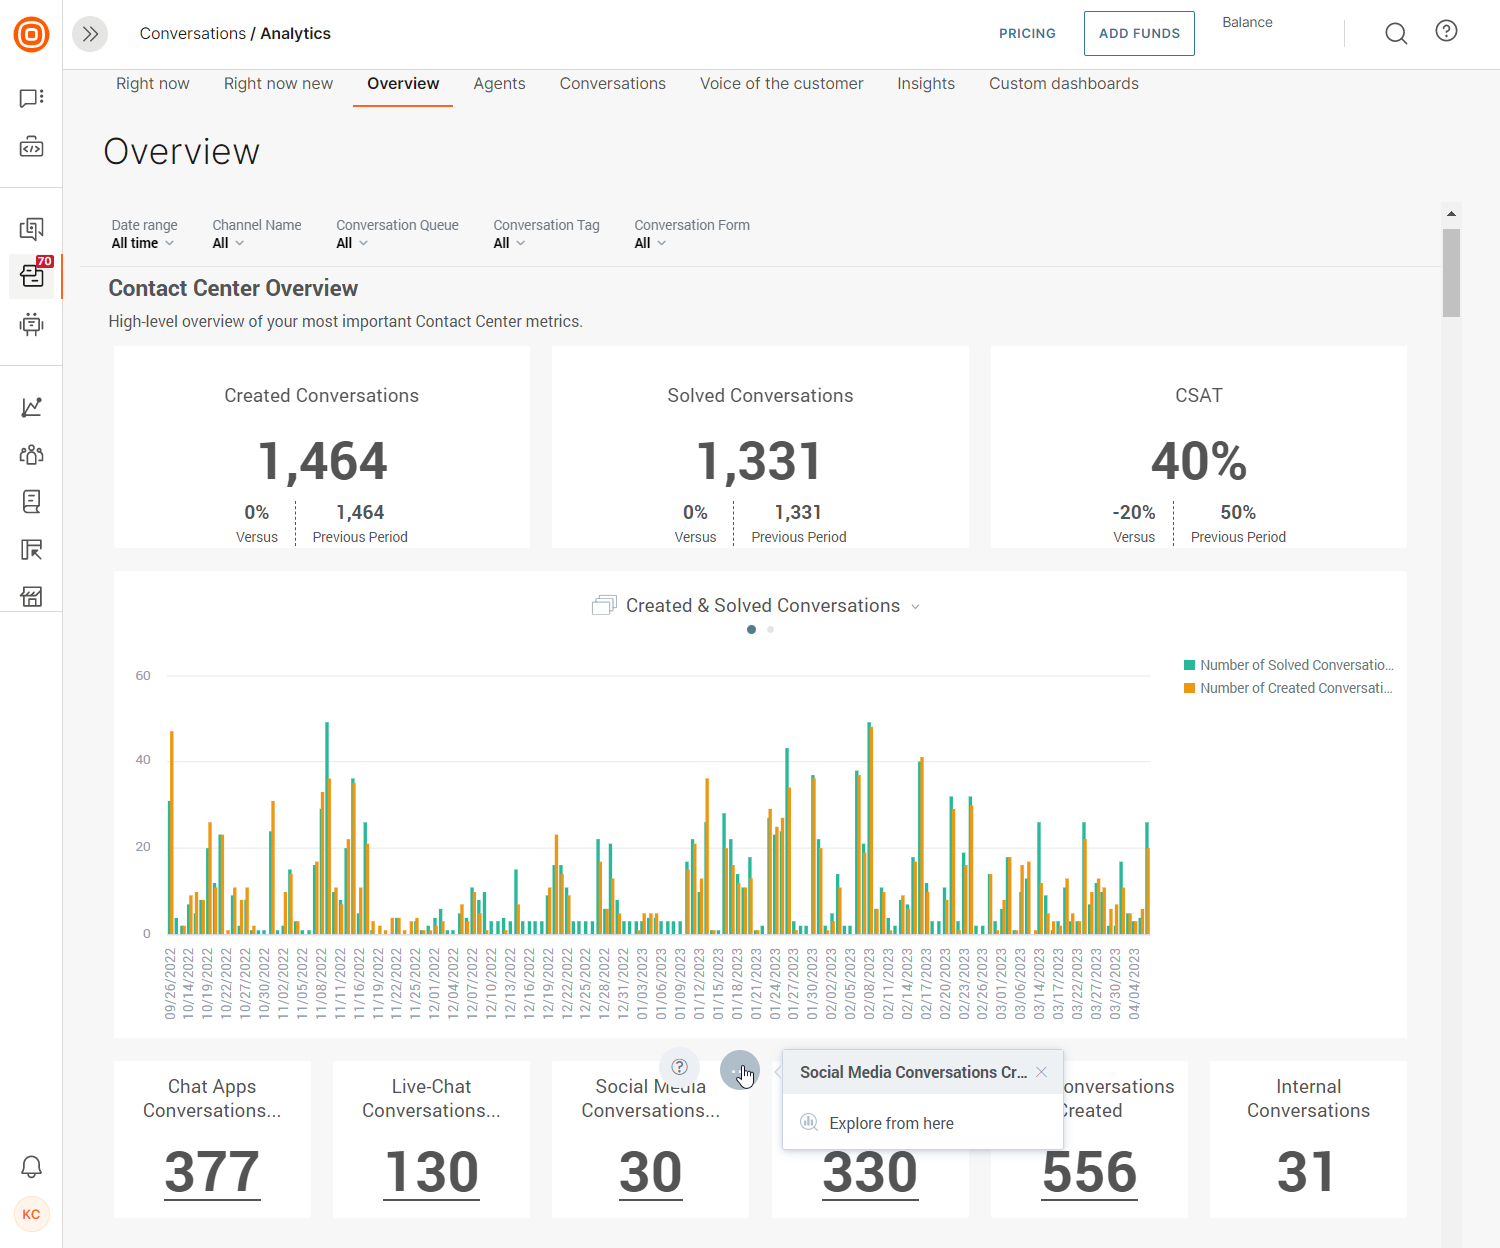
Contact Center Overview
A high-level overview of the most important indicators of your contact center. Here you have an insight into the number of Created vs. Solved conversations as well as how they are doing compared to the previous period.
Also, this overview provides you with one of the most important metrics - Customer Satisfaction Score (CSAT).
Another interesting overview is that you can see the work distribution per channel category (the number of conversations created per category). You can further explore each of these channels categories to see more details.
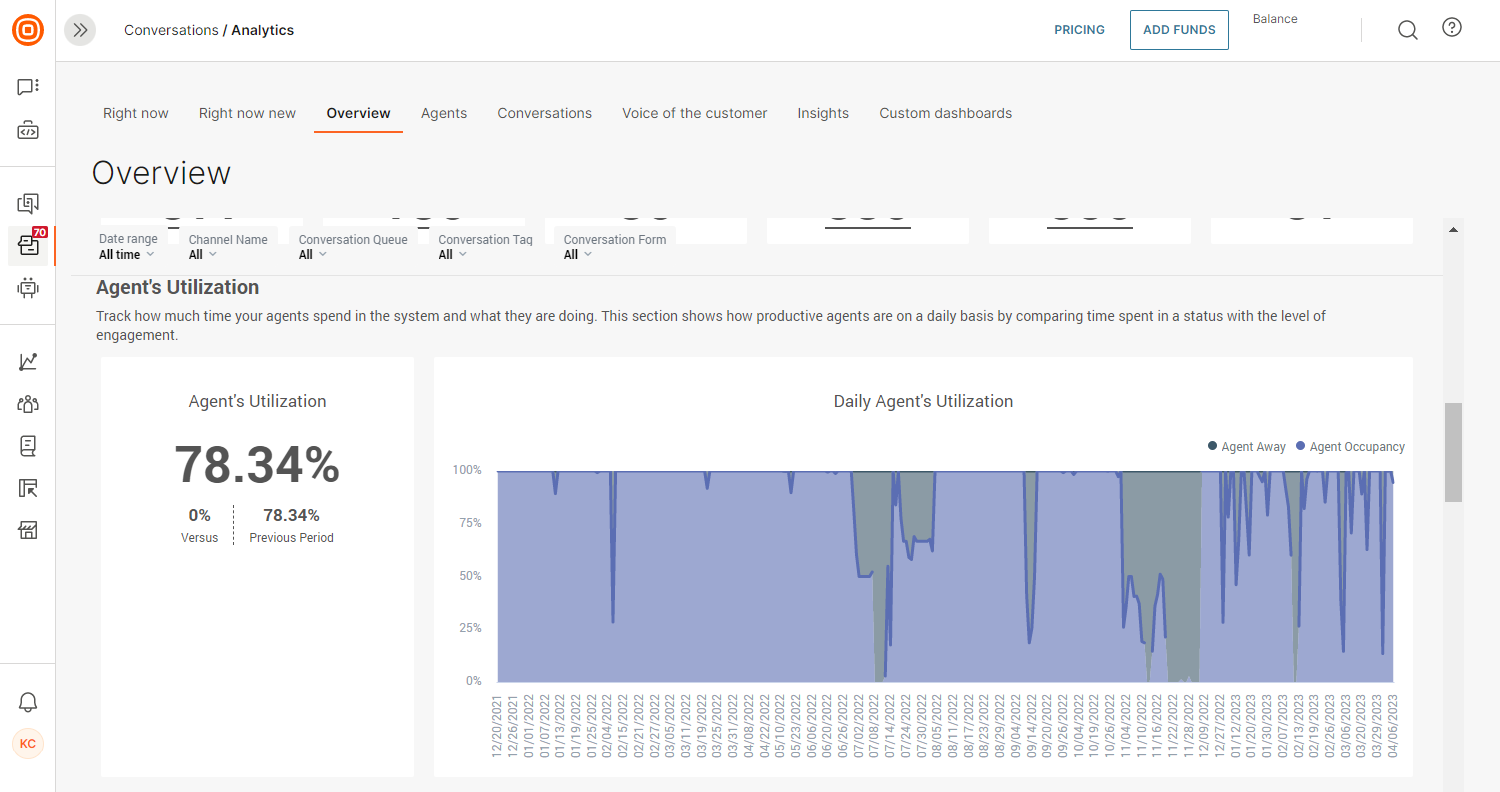
Agent's utilization
Track how much time your agents spend in the system and what they are doing. This section shows how productive agents are on a daily basis by comparing the time spent in a status with the level of engagement.
The metric on the left shows the percentage of time agents spend as Available or Busy out of total logged-in time. The metric on the right shows the ratio of logged-in time agents spent being productive (Available and Busy) versus time spent in an Away status.
You can further expand on both of these and go into detail.
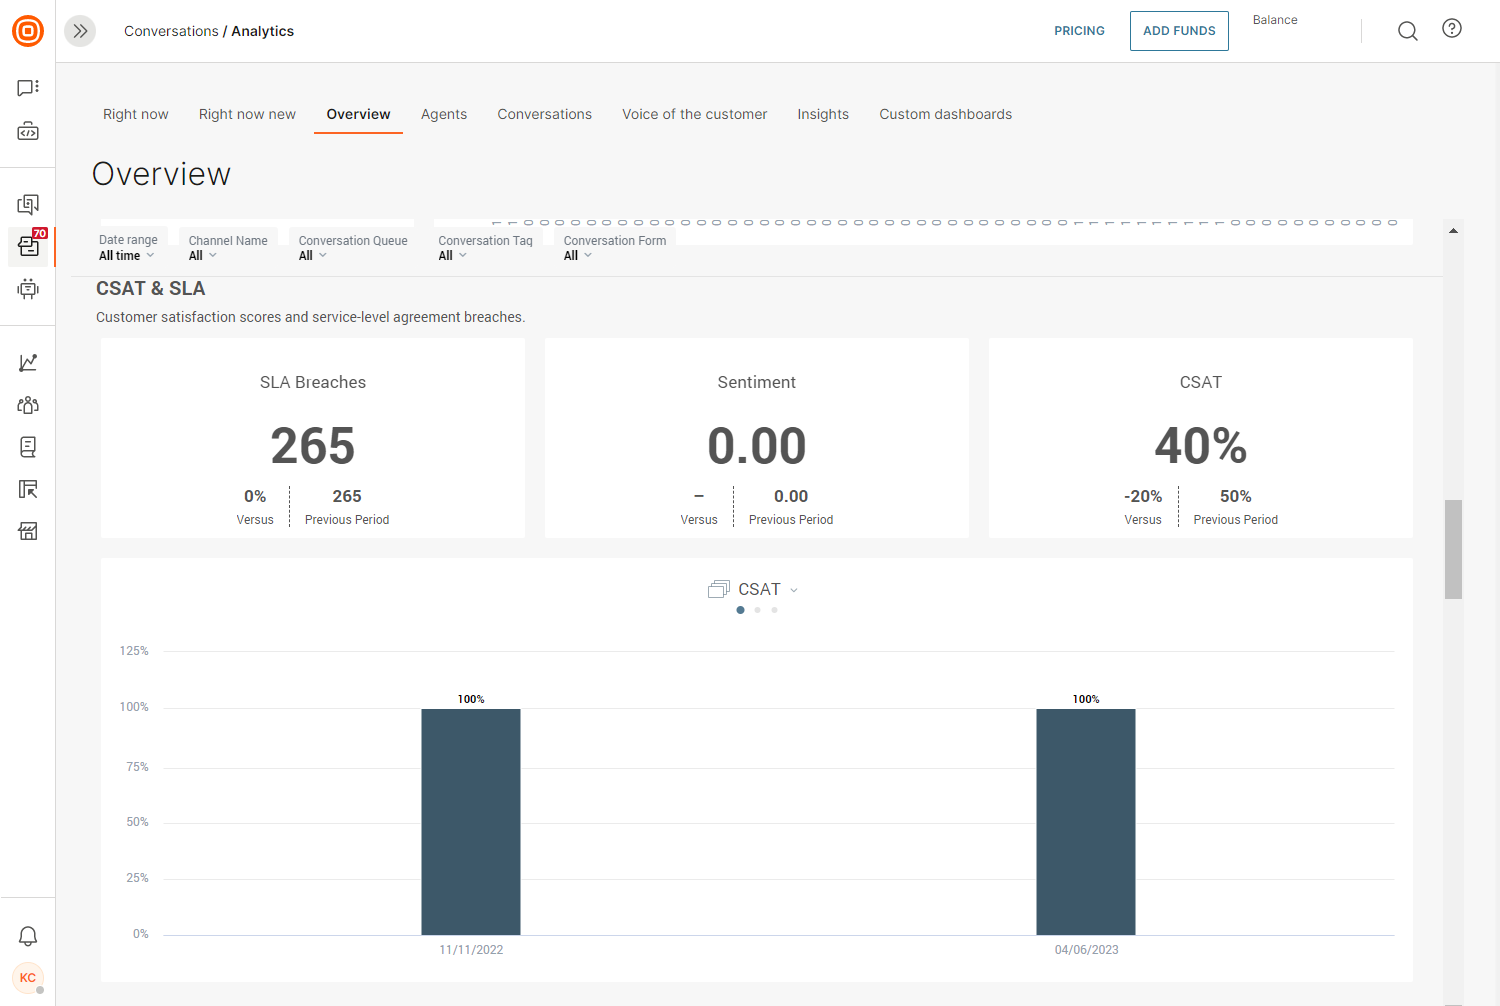
CSAT & SLA
A customer satisfaction score is considered to be the most important indicator of the success of a helpdesk. Combined with the Service-level Agreement (SLA) numbers, this section provides a powerful insight into the success of your helpdesk.
The first metric shows the number of SLA breaches versus the previous period you have selected.
In the middle, you can see the median sentiment score of all conversations. The sentiment is basically how the system interprets conversations between agents and customers and how the customers are feeling based on what they are communicating to the agents. Sentiment analysis uses machine learning to come up with the score of the conversation.
The metric on the right shows the customer satisfaction percentage of positive survey responses.
Most Popular Tags
Conversations tags are added to conversations automatically, or agents add them manually. Tags tell you why a conversation was created or why the customer is contacting you. The frequency of a certain tag can provide an insight into a product or service and help you decide if you need to make any changes in your contact center.
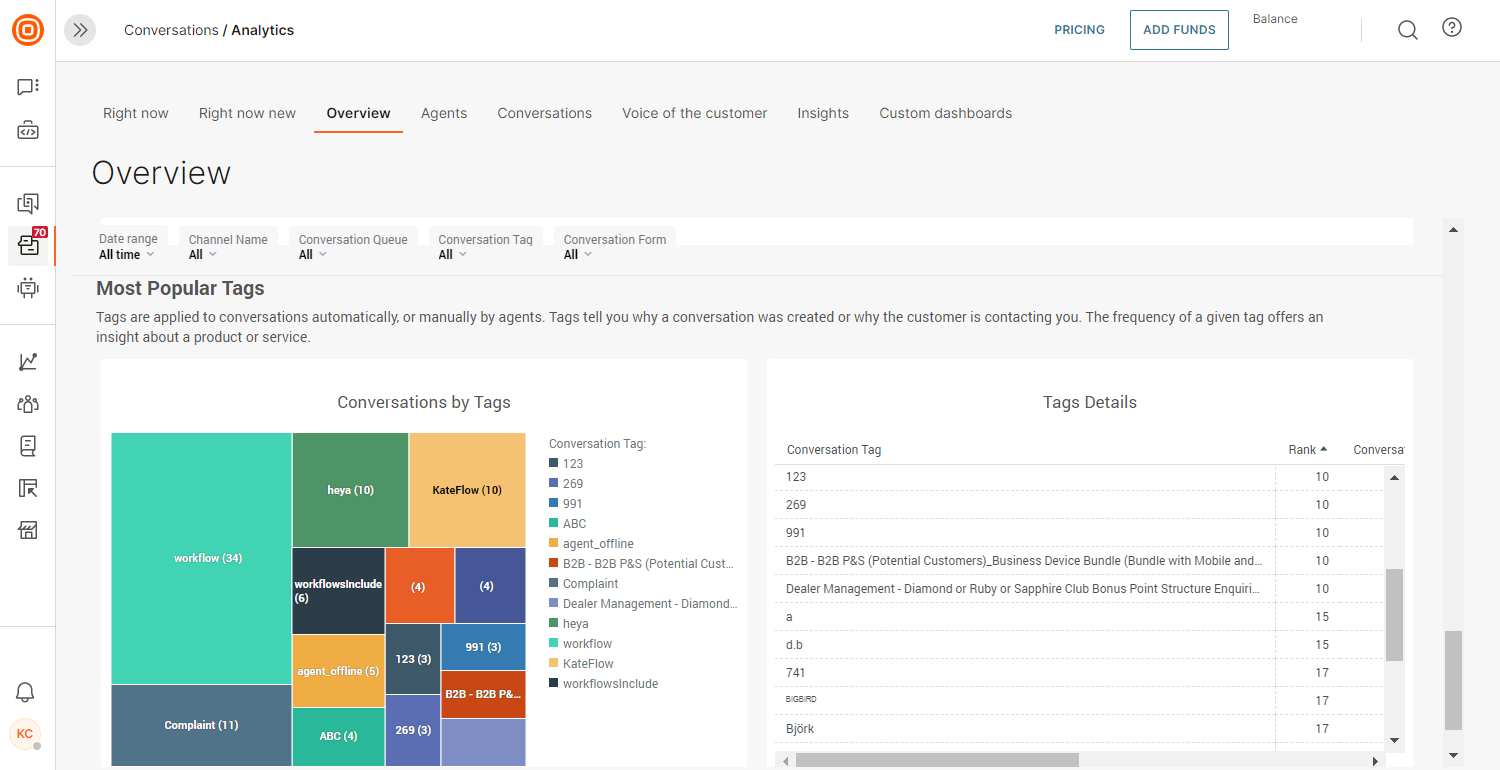
Use the three-dot button to further expand on the details and performance of each tag.
Agents
The Agents analytics tab is the central place to check the performance of all your agents, the number of conversations they are handling, the number of customers they are serving, their responsiveness, and utilization.
 You can filter the data based on your desired criteria:
- Date range
- Agent Info
- Channel Name
- Conversation Queue
- Conversations Tag
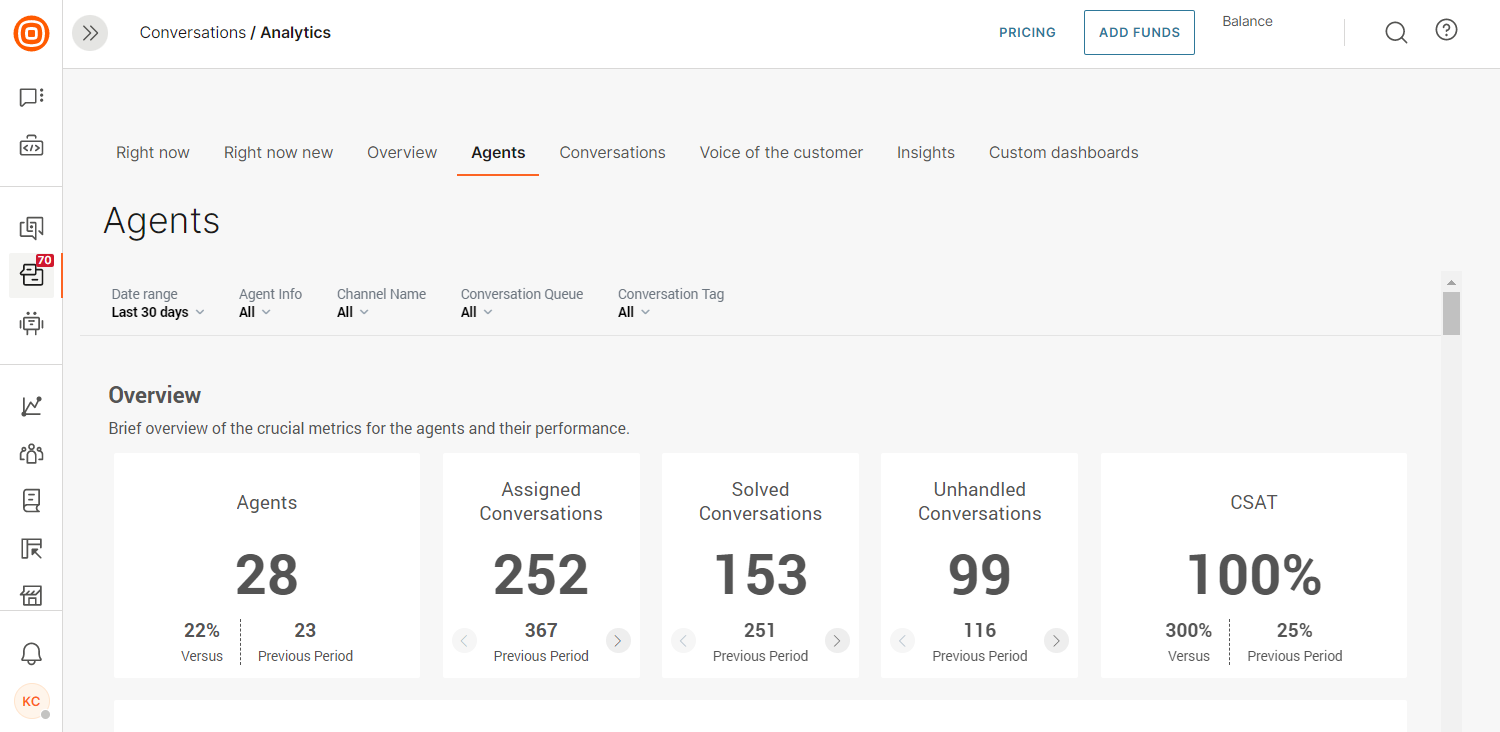
Overview
Shows a brief overview of the crucial metrics for the agents and their performance.
Here you can see the number of agents actively working on conversations based on your filter criteria. Also, you can see the number of offered, solved, and unhandled conversations, as well as the CSAT.
Agents overview
Shows a list of agents who are actively working on conversations (based on your search criteria). You can further expand on this or export the list by clicking on the three-dot button on the far right side.
Here you can see the number of conversations (offered, solved, unhandled), the number of customers served, the average first response time and average resolution time, plus the CSAT.
Responsiveness
This section provides info about how responsive your agents are, how fast and efficient they are in resolving incoming inquiries, as well as the top and bottom-performing agents.

Looking from left to right, the very first insight shows the average first response time. This time is measured from the time a conversation is created until the time an agent sends the first message.
The third insight here shows the average resolution time. This time is measured from the start of a conversation until its status is changed to Solved or Closed.
The fourth insight here shows the average number of customer's messages per a single conversation, while the fifth insight displays the number of agent's messages per a single conversation.
And the last insight displays the average number of messages exchanged between agents and customers.
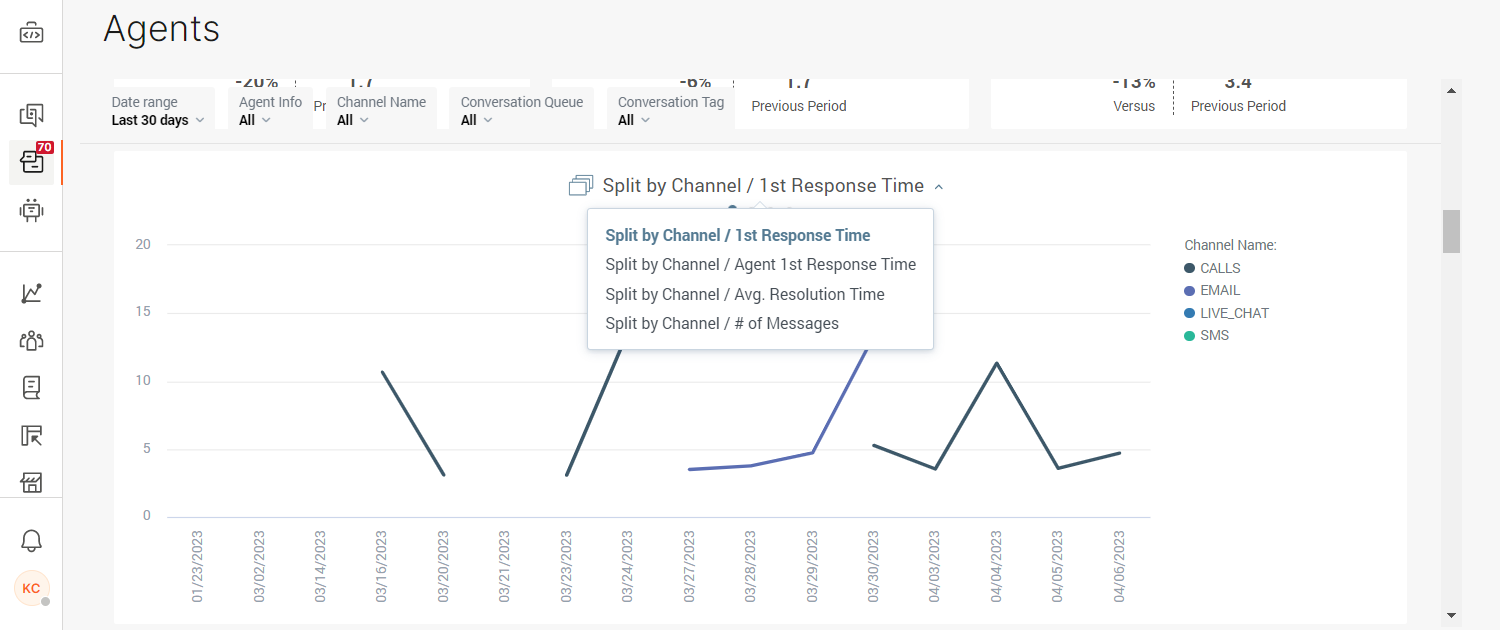
Below these, you will find an insight that shows a few metrics performing per channel:
- 1st Response Time
- Agent 1st Response Time
- Avgerage Resolution Time
- Number of Messages
NOTE
The first response time counts the whole time from the creation of the conversation until the agent has replied.
Example: A new conversation was created on 2022/10/24 at 07:32:20, and the agent replied on 2022/10/24 at 15:27:20. The first response time here is 07h 55m.
The next two insights represent the top and bottom-performing agents based on these metrics:
- Agent 1st Response Time
- Resolution time
- CSAT
- Percentage of conversations with 1 message
Here you can determine if you need to talk to any of your agents regarding their performance as these metrics will show the true state of your entire agent workforce.

Effort
Analyze your agents' effort based on the incoming workload.
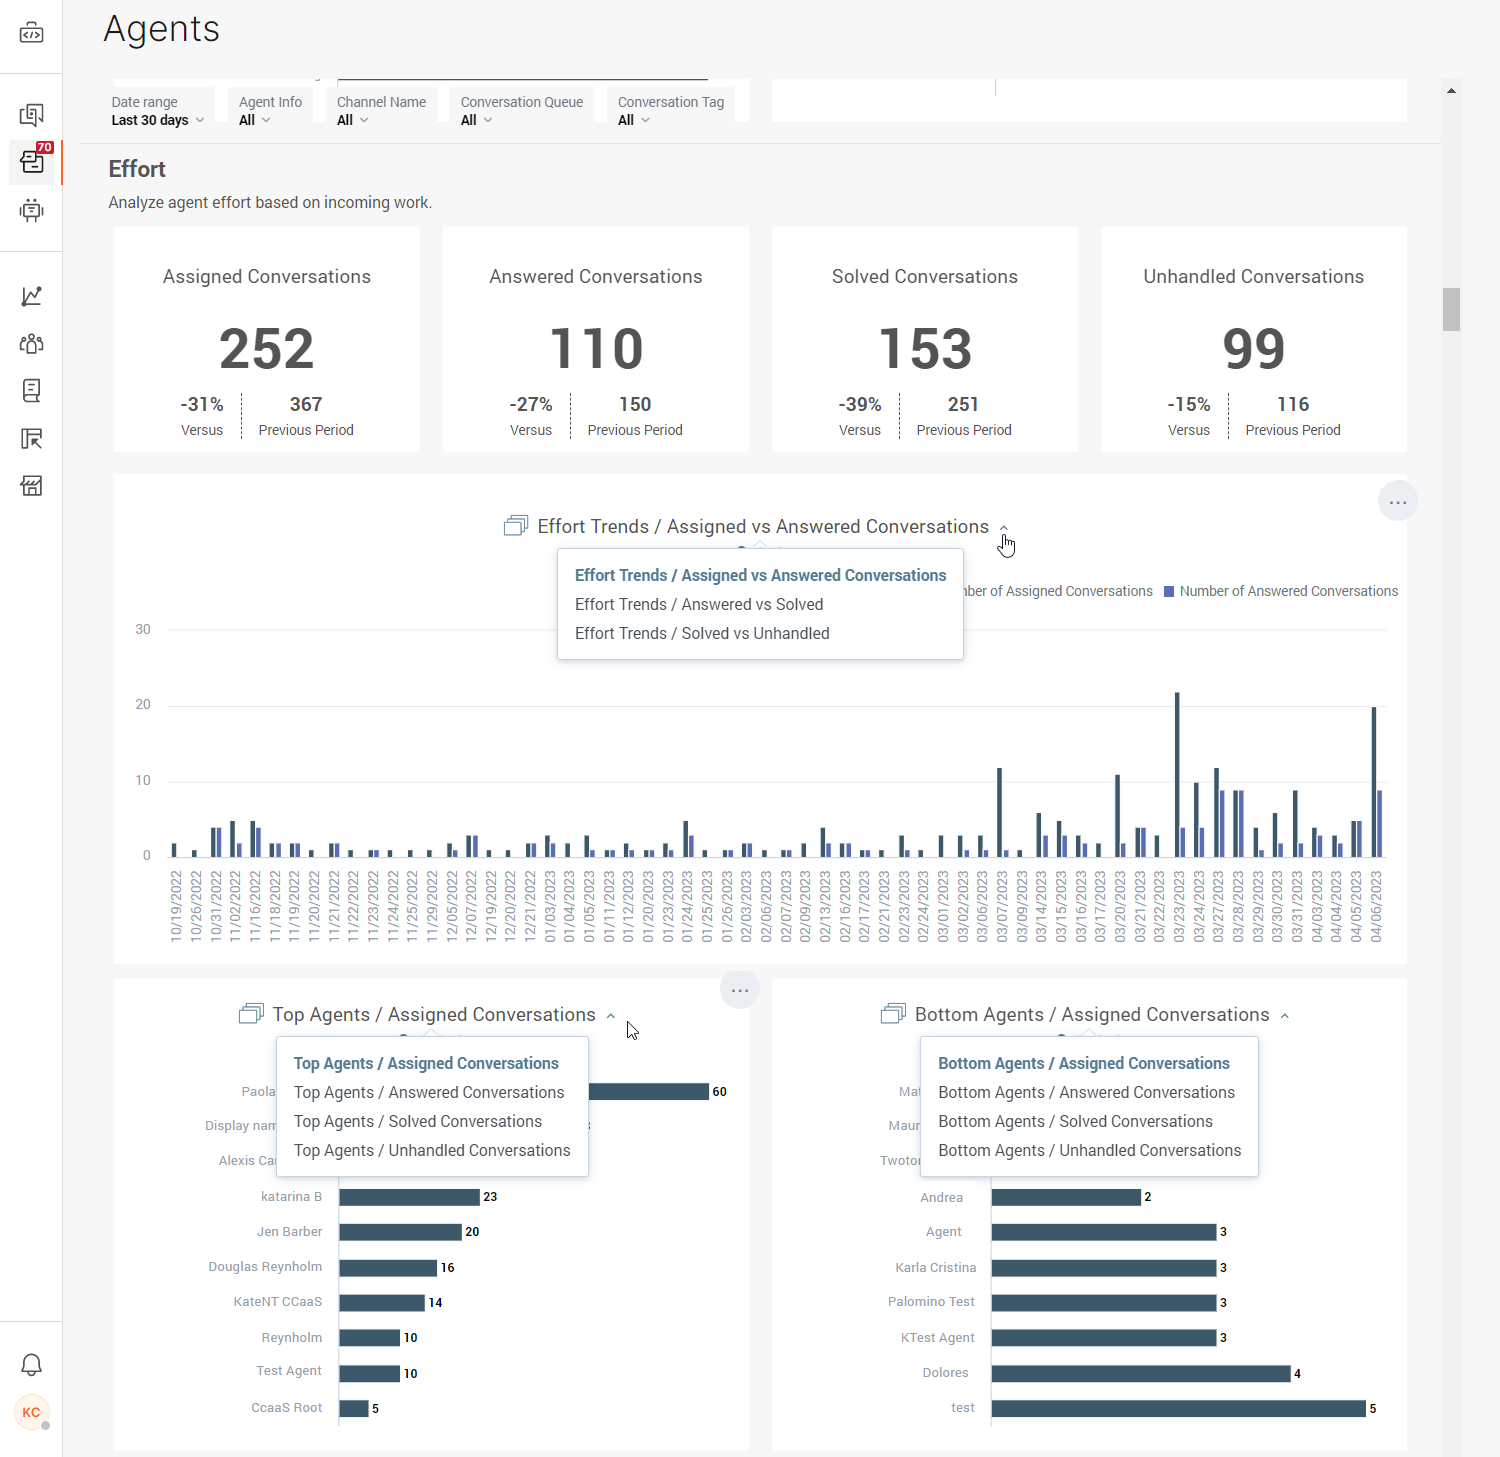
In this section, you can see the number of offered, answered, solved, and unhandled conversations based on the selected time period.
Furthermore, you can drill down to effort trends and see a comparison graph between:
- Assigned vs. Answered Conversations
- Answered vs. Solved
- Solved vs. Unhandled
The last insight under efforts gives you an overview of top and bottom-performing agents per any one of these criteria:
- Assigned Conversations
- Answered Conversations
- Solved Conversations
- Unhandled Conversations
Utilization
These analytics provide insight into how much time your agents spend in the system and what they are doing. Check out how productive your agents are on a daily basis by comparing time spent in a particular status with the level of engagement.
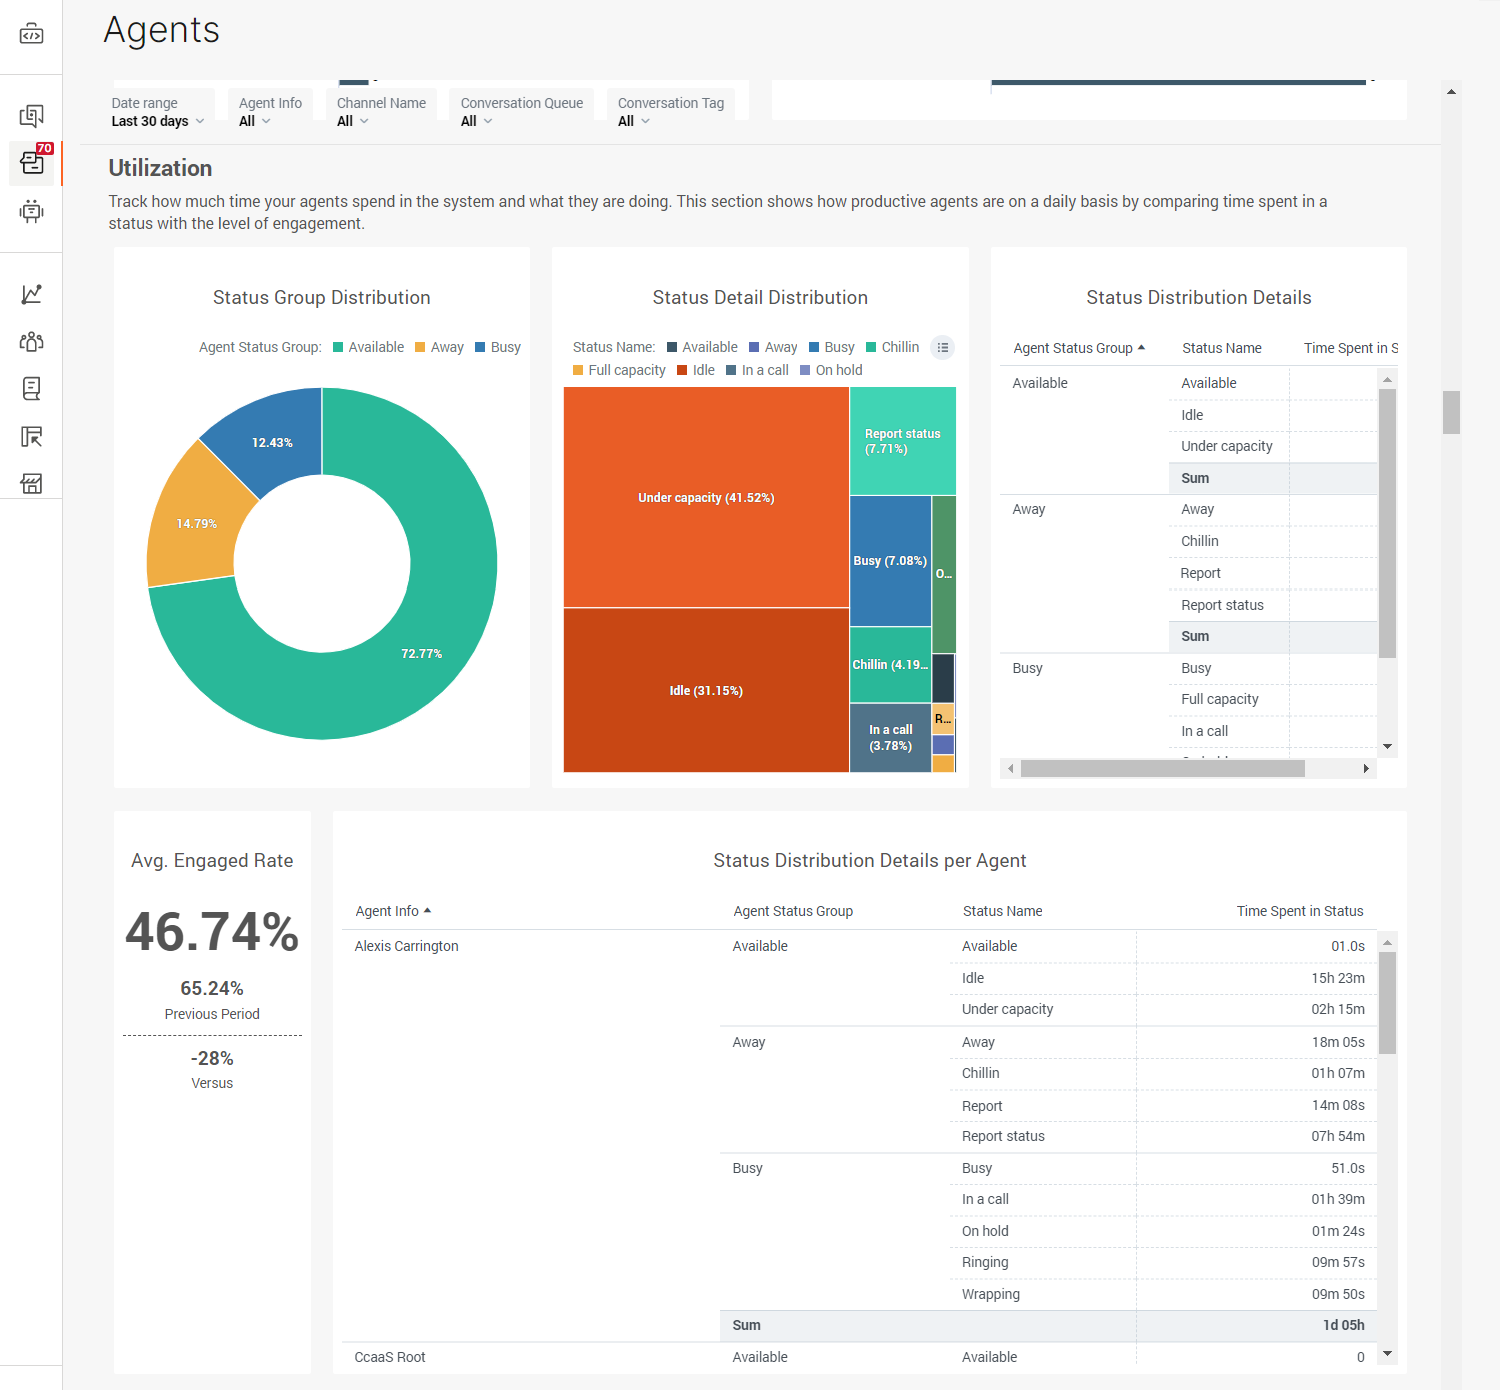
The Status Group Distribution insight showcases the percentage of their time spent per status group. You can click on any of the groups to view details.
The Status Detail Distribution goes further into detail and displays the percentage your agents have spent in each status.
NOTE
By default, all statuses are displayed on the graph. You need to click on the status name to exclude it from the graph. Or click on it once again to include it.
The Status Distribution Details insight shows the total agent time spent in each status group (and in each status). To view this data per individual agent, check out the Status Distribution Details per Agent just below this one.
Average Engaged Rate is the time agents spend in status in which they actively interact with customers. These are the statuses which count toward this metric:
- Full capacity
- Full capacity (mobile)
- In a call
- Ringing
- Under capacity
- Under capacity (mobile)
- Wrapping up
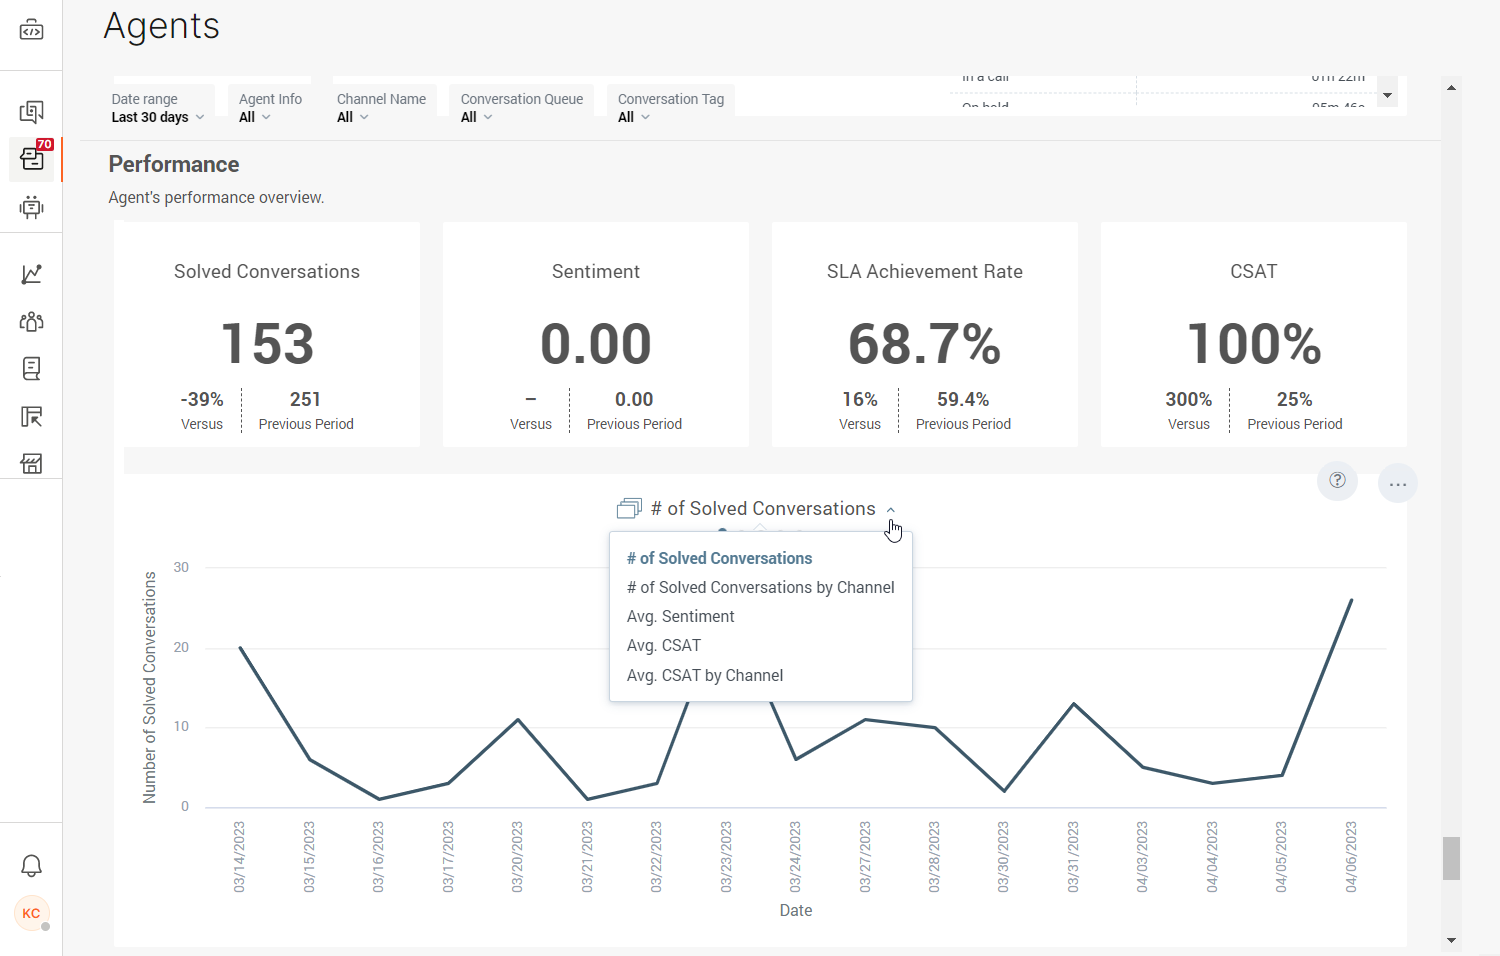
Performance
This metric provides an overview of your agents' performance:
- Solved Conversations shows all conversations marked as solved or closed in the selected time range and filter criteria.
- Sentiment shows the median sentiment score in conversations handed by the selected agent(s).
- SLA Achievement Rate outlines the percentage of conversations that fulfilled their service-level agreement.
- CSAT displays the percentage of positive survey responses.
Dive deeper into these metrics and check out the graph below them which you can use to view:
- The number of solved conversations
- The number of solved conversations by channel
- Average sentiment
- Average CSAT
- Average CSAT by channel
Conversations Details
All filtered conversations with the most important information listed. This is basically a list of all conversations that meet your search criteria.
Click on any of the Conversation IDs to go to that specific conversation in the All Work panel.

Conversations
Dive deeper into details about all conversations in your contact center.
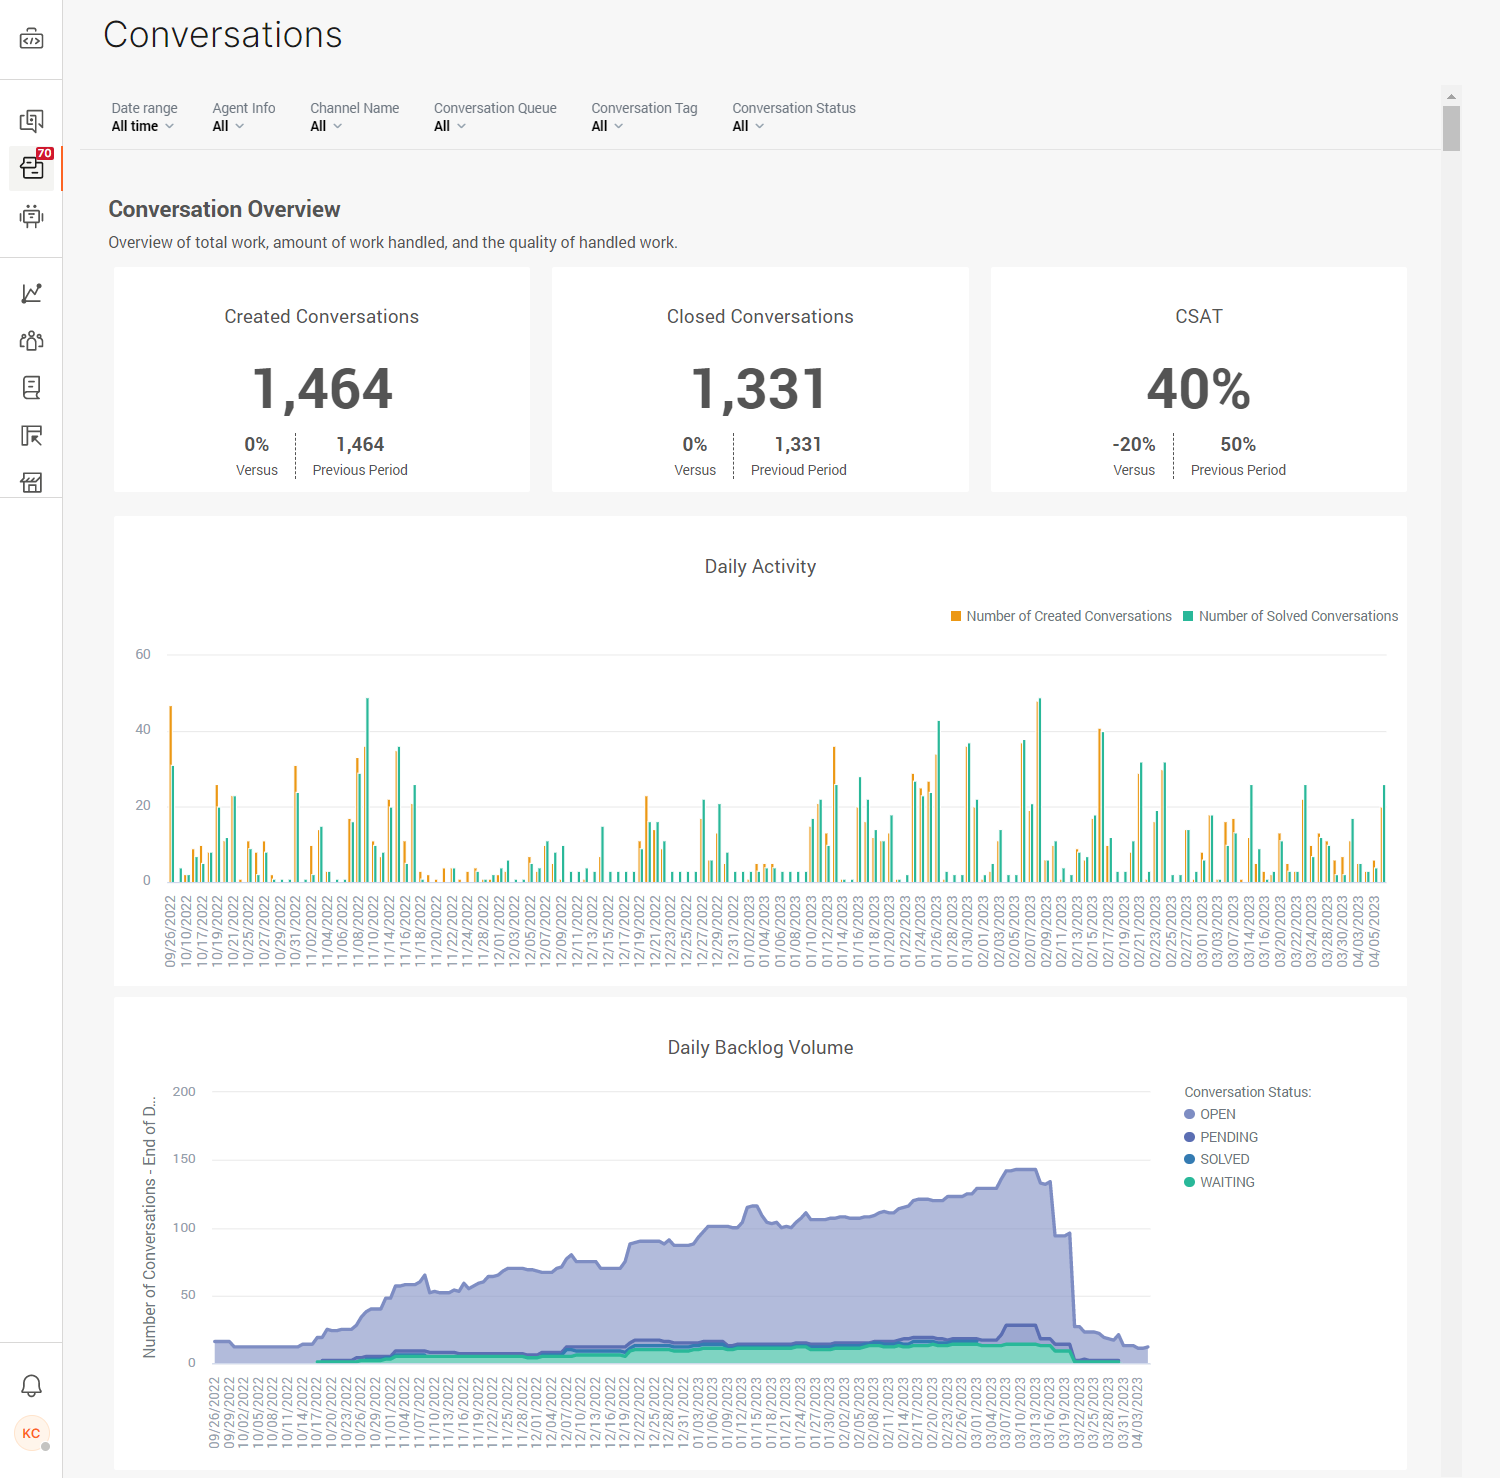
Conversation Overview
Overview of total work, amount of work handled, and the quality of handled work:
- Created Conversations are all conversations created in the selected time range that meet your filter criteria.
- Closed Conversations are all conversations marked as Solved or Closed in the selected time range that meet your filter criteria.
- CSAT is the percentage of positive survey responses.
- Daily Activity graph displays the number of created and solved conversations for the past 30 days.
- Daily Backlog Volume graph displays the number of tickets per day that are in the backlog.This graph updates automatically at the end of each day. Here you will see Open, Waiting, and Solved number of tickets, and all are turned on by default. Click on any of them to exclude this data from the graph.
Tags, Queues and Channels
Get an insight into the most frequently used tags and how queues and channels are performing. These graphs display conversations by tags, the number of conversations per queue, and the number of conversations per each channel.
NOTE
The graph will display a bigger square for those items with a higher frequency of usage.
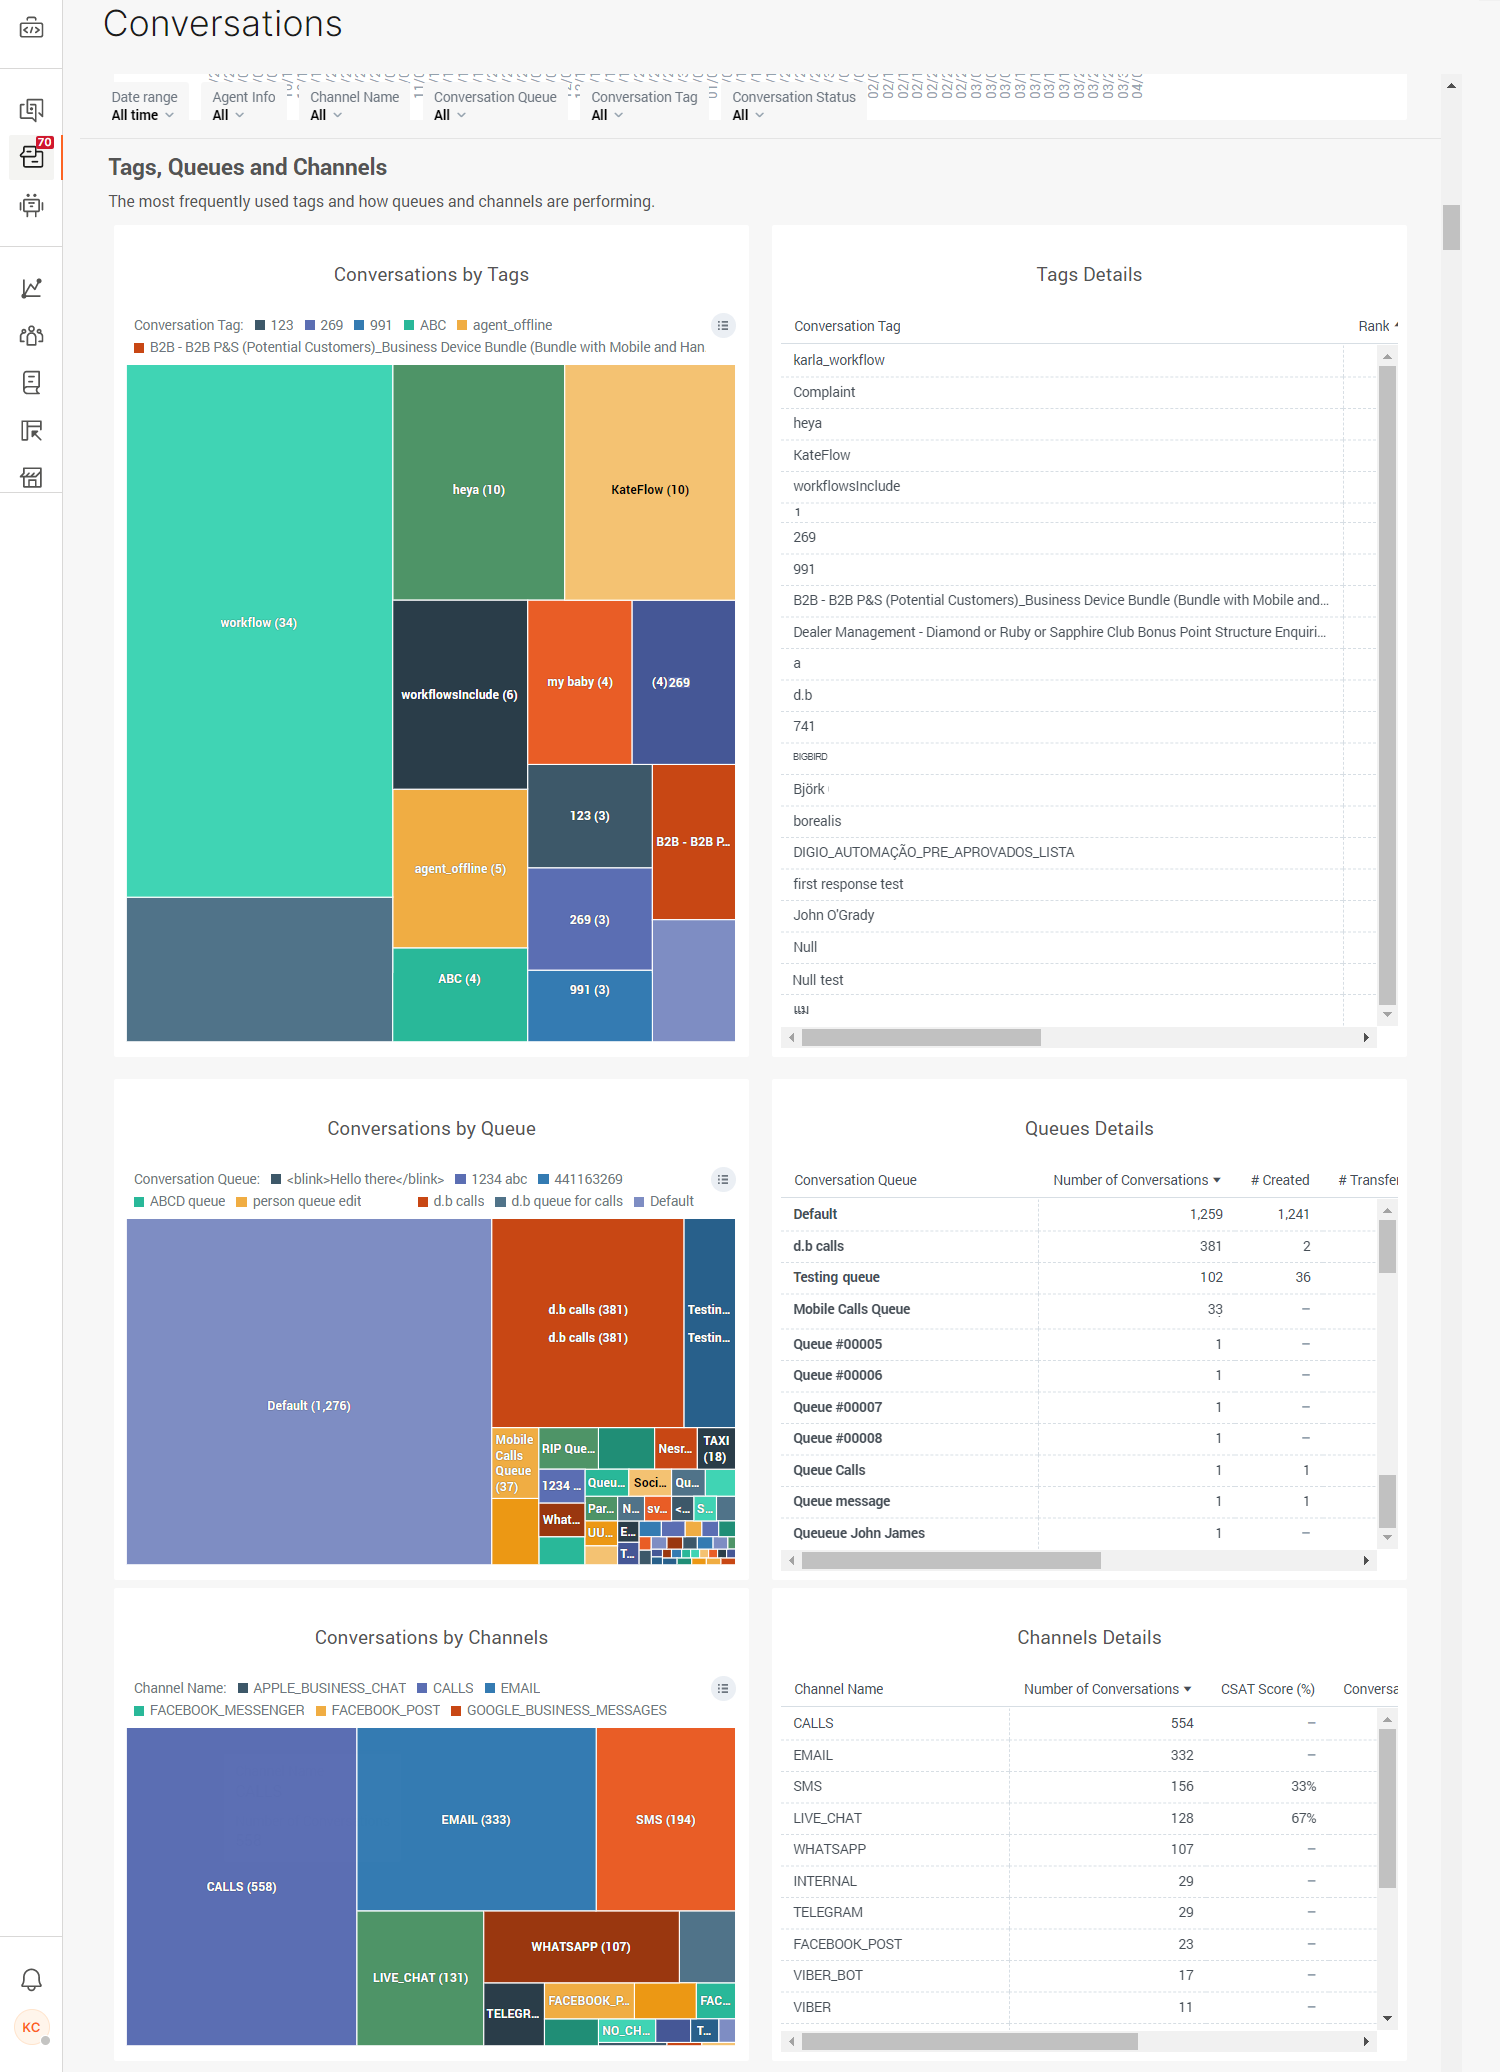
Play around with the graphs and explore insights further, or export the report by clicking on the three-dot button and selecting one of the export options.
On the right side of this section, you can see more details for tags, queues, and channels.
Conversations Distribution Details
This section offers more info regarding the distribution of conversations based on important indicators such as wait time and CSAT score.
- Conversations by Number of messages represents the number of times an agent replied in a conversation (a single touch denotes one reply from an agent).
- CSAT Distribution displays how many conversations had a customer satisfaction survey sent.
- Waiting time distribution shows the average waiting times for conversations per each hour of the day.
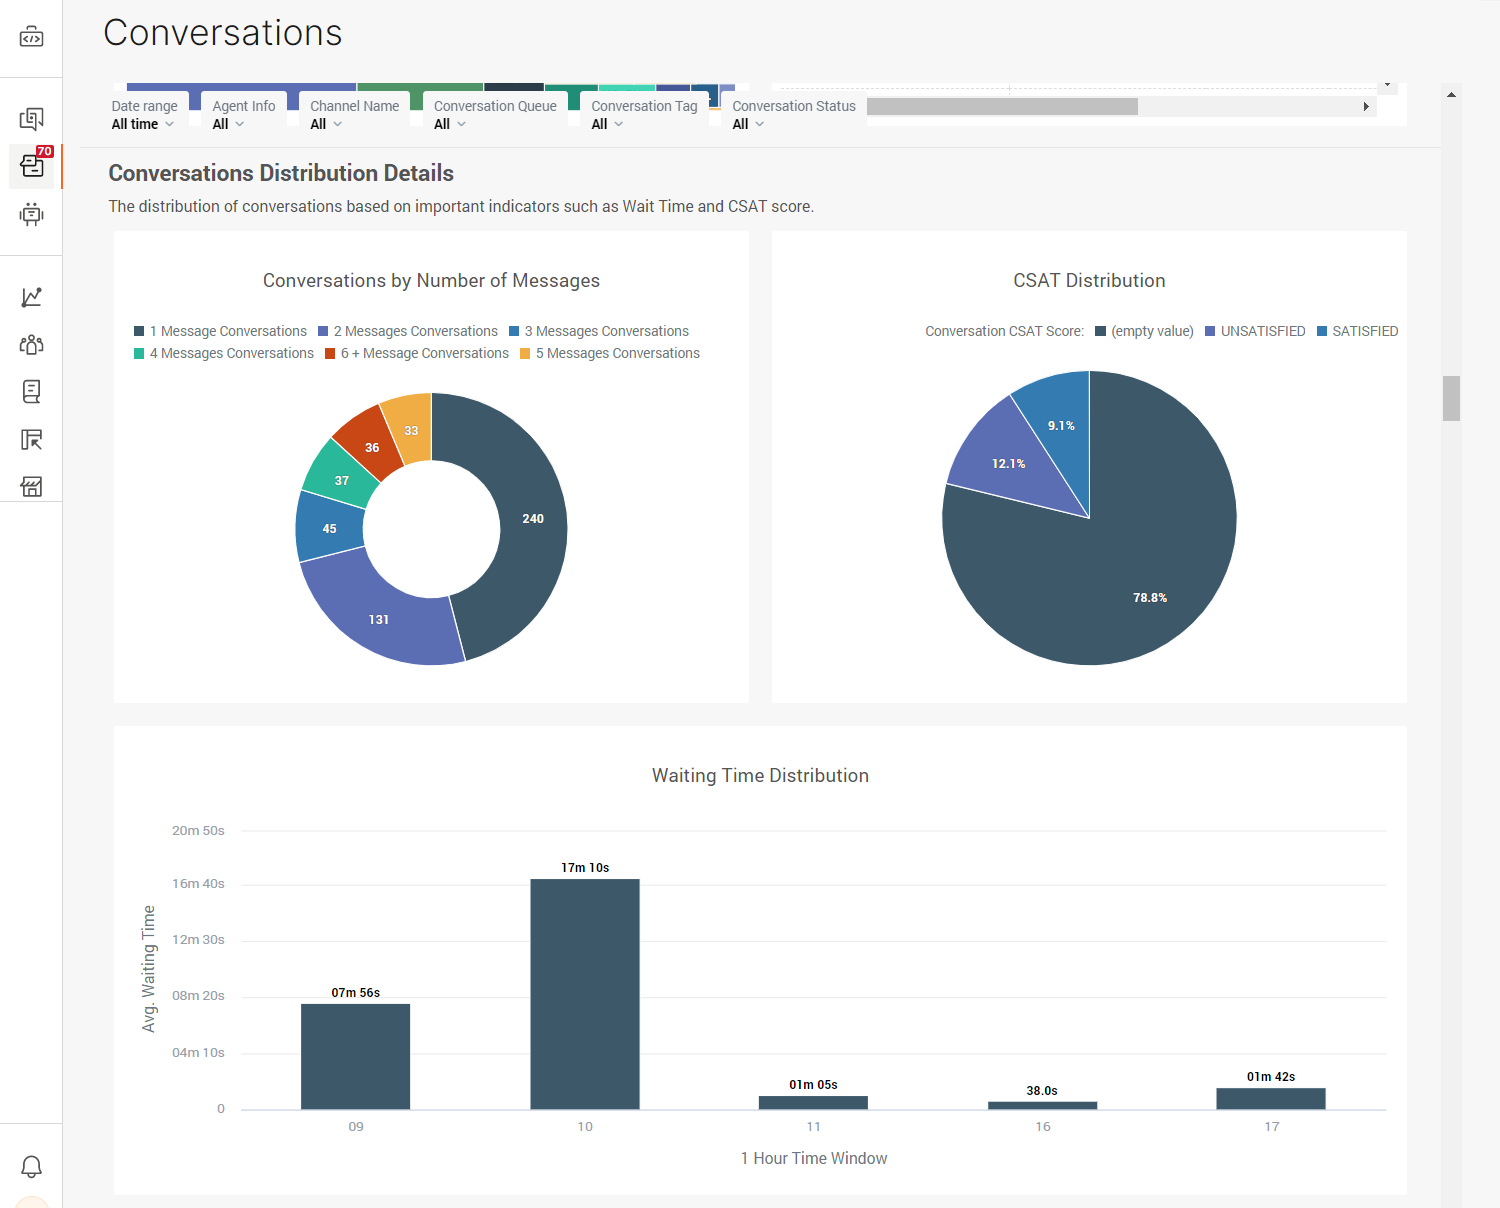
INFO
Waiting time refers to the time that a conversation spent in the WAITING status.
Conversations Timing Distribution
Shows when most of your conversations happen. This section helps you determine the busiest days and recognize peak times. This graph shows the most popular days (in terms of the number of conversations created on that day).
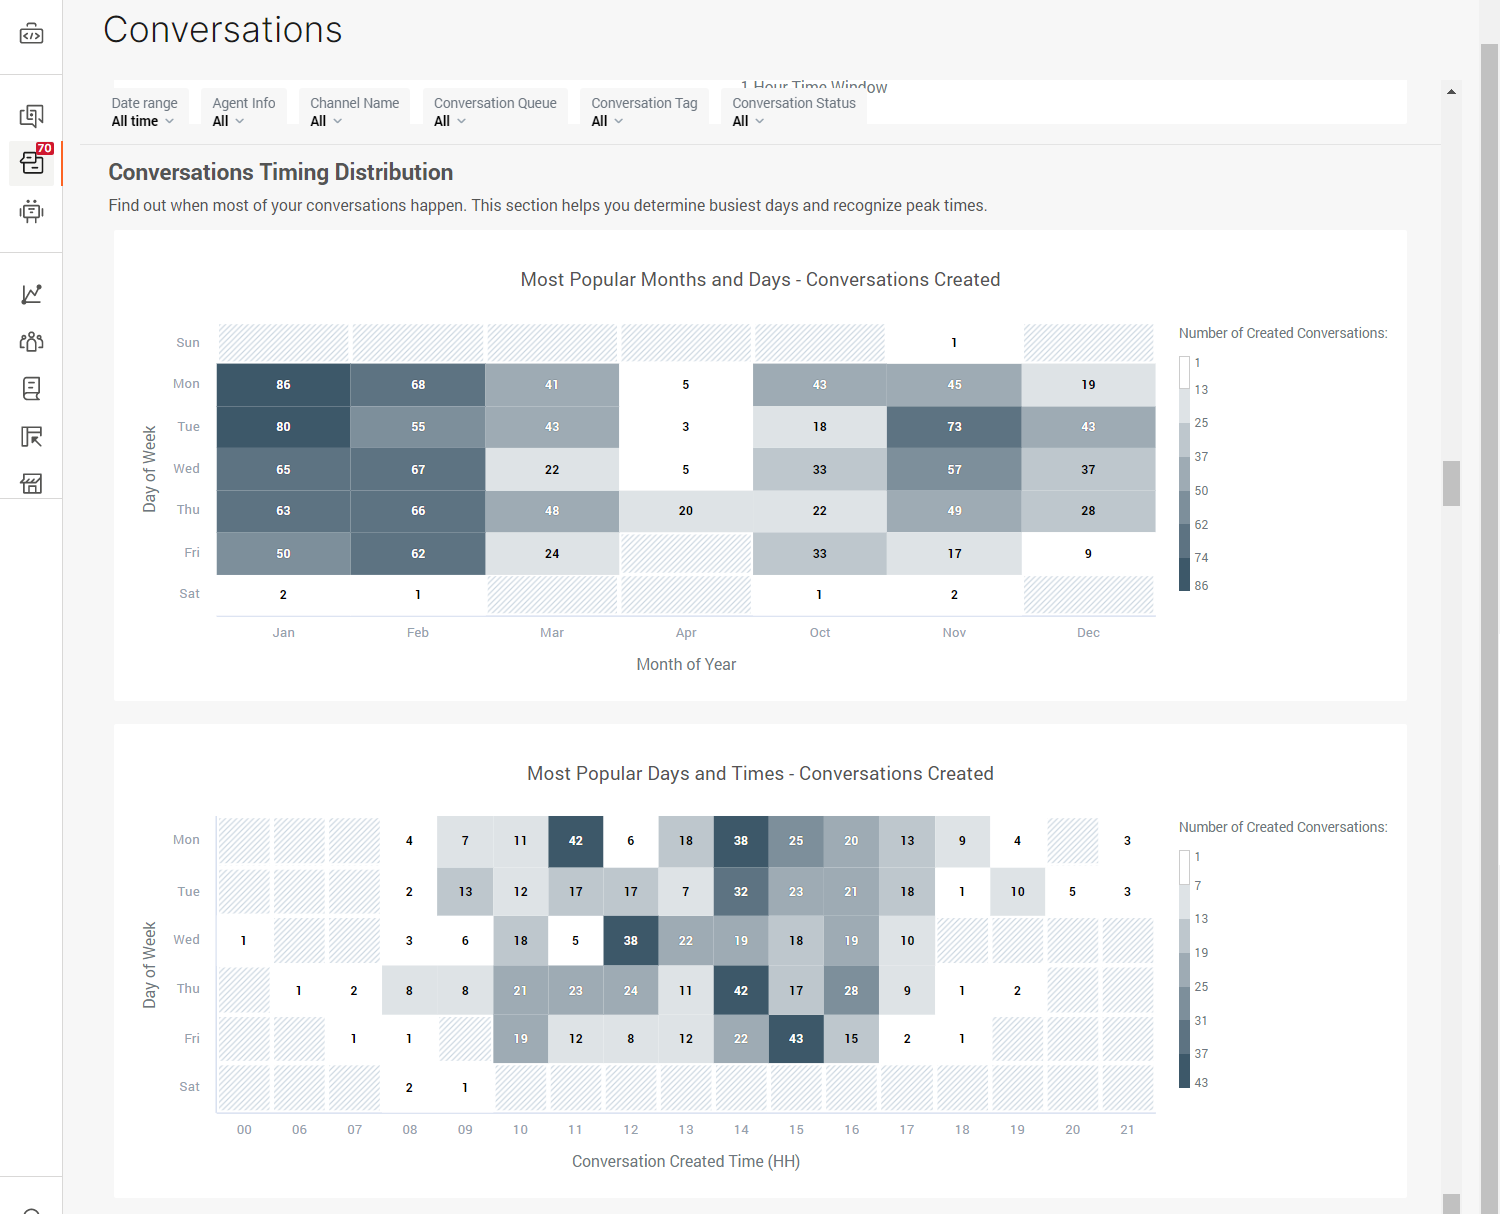
Below this graph, you can also check out the number of created conversations per every hour of every day of the week.
Conversations details
All filtered conversations with the most important information listed. This is basically a list of all conversations that meet your search criteria.
Click on any of the Conversations IDs to go to that specific conversation in the All Work panel.
Voice of the Customer
All of the analytics gathered do not mean much without the user feedback and CSAT helps you obtain that feedback, and analyze it to determine if you need to make any changes in your contact center.
INFO
Besides analytics and reports that you can get from these pages, use the customer satisfaction survey to gather data directly from the users themselves. Allowing users to engage with a CSAT survey is the quickest way to find out if the service you are providing to your customers is satisfactory or if you need to work on improving it.
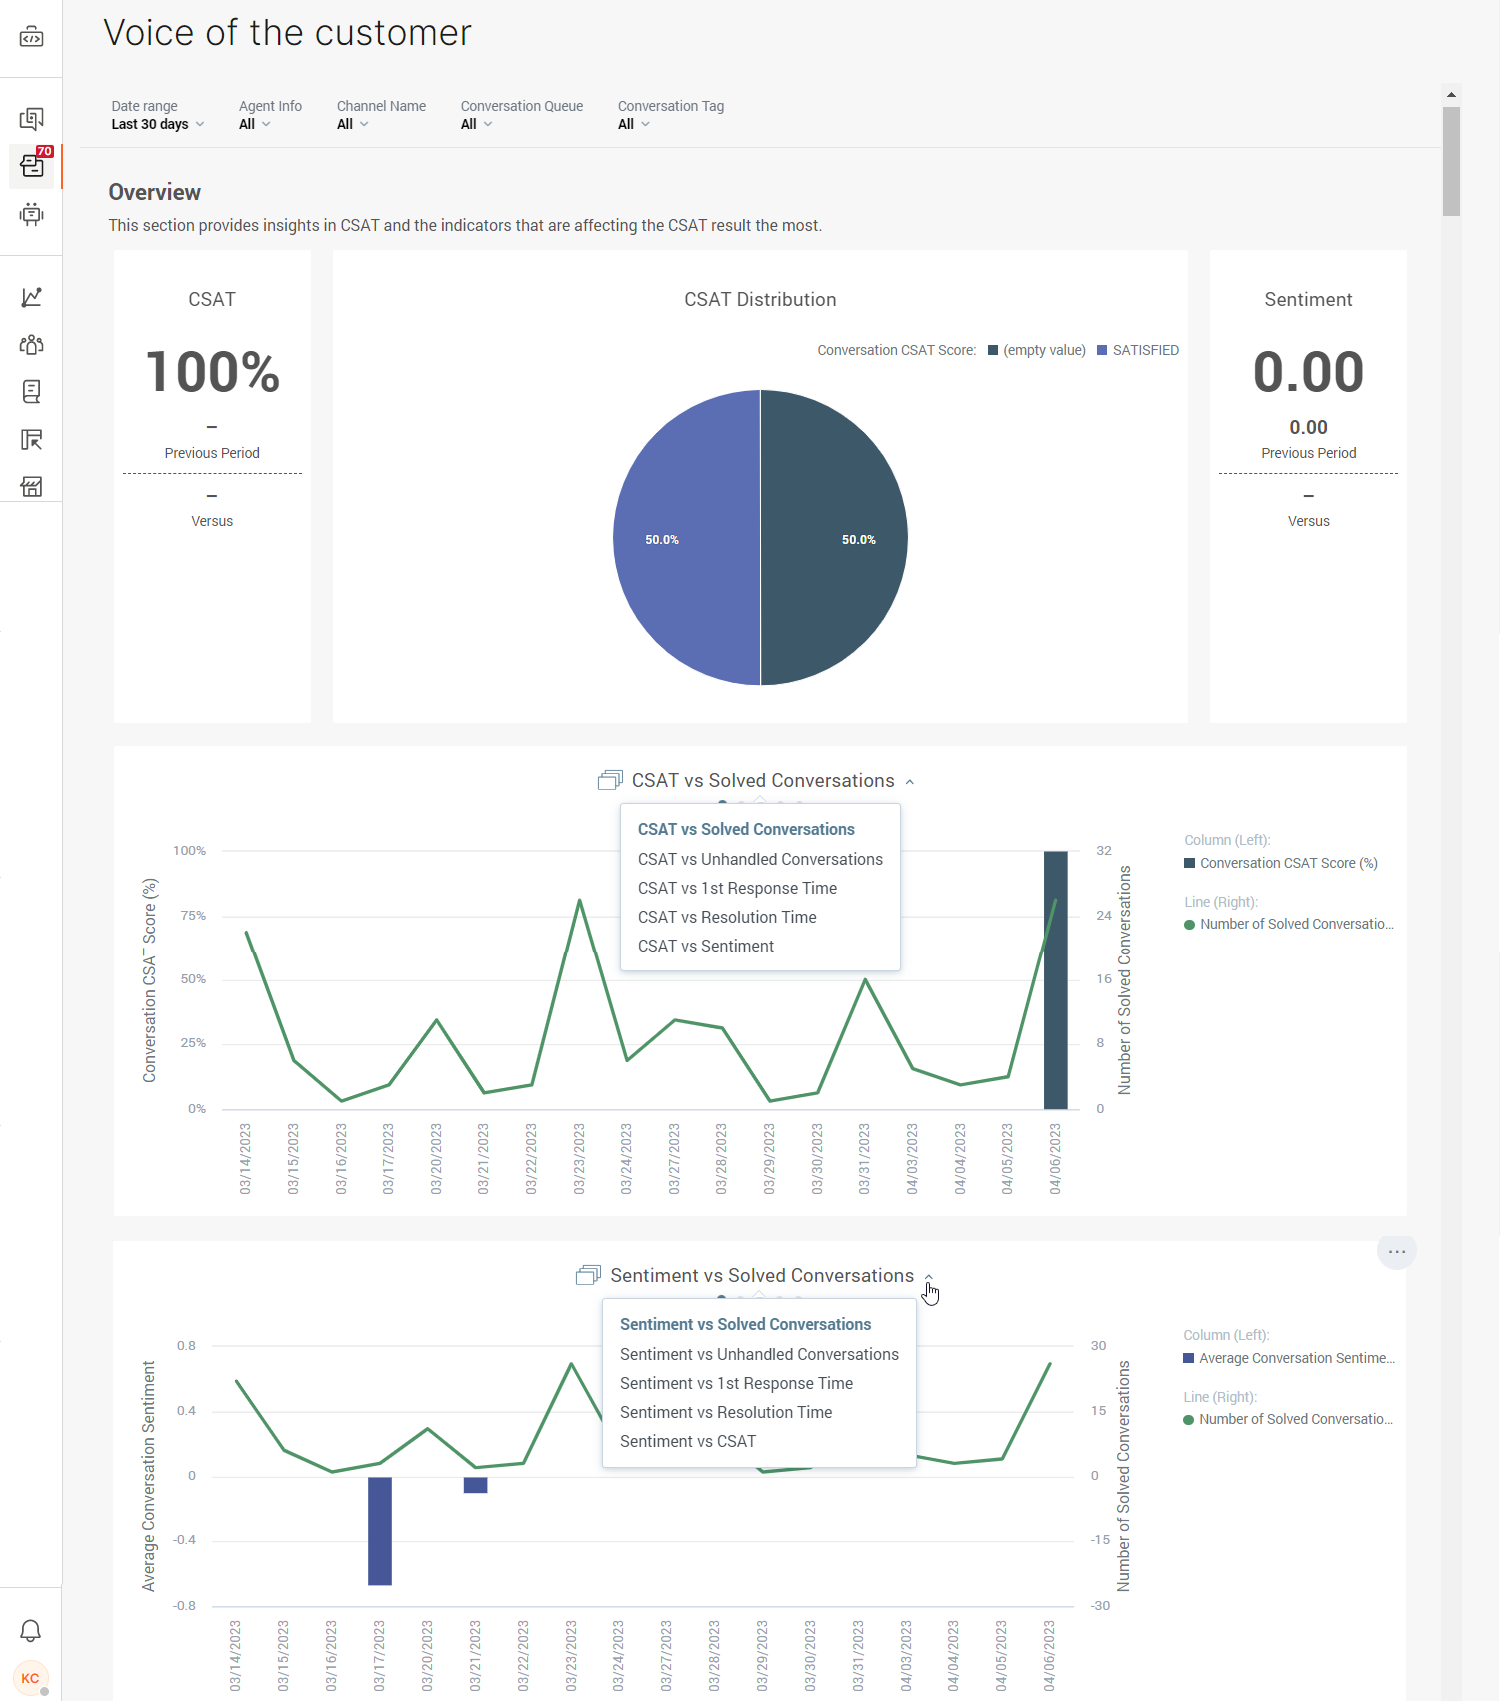
Overview
This section provides insights into customer satisfaction and the indicators that are affecting the CSAT result the most. Here you can see the CSAT score (based on percentage), the distribution of CSAT in conversations, and the median sentiment score.
If you wish to go into detail, check out the 2 graphs below the overview that showcase the CSAT in relation to other important metrics + sentiment in relation to other important metrics.
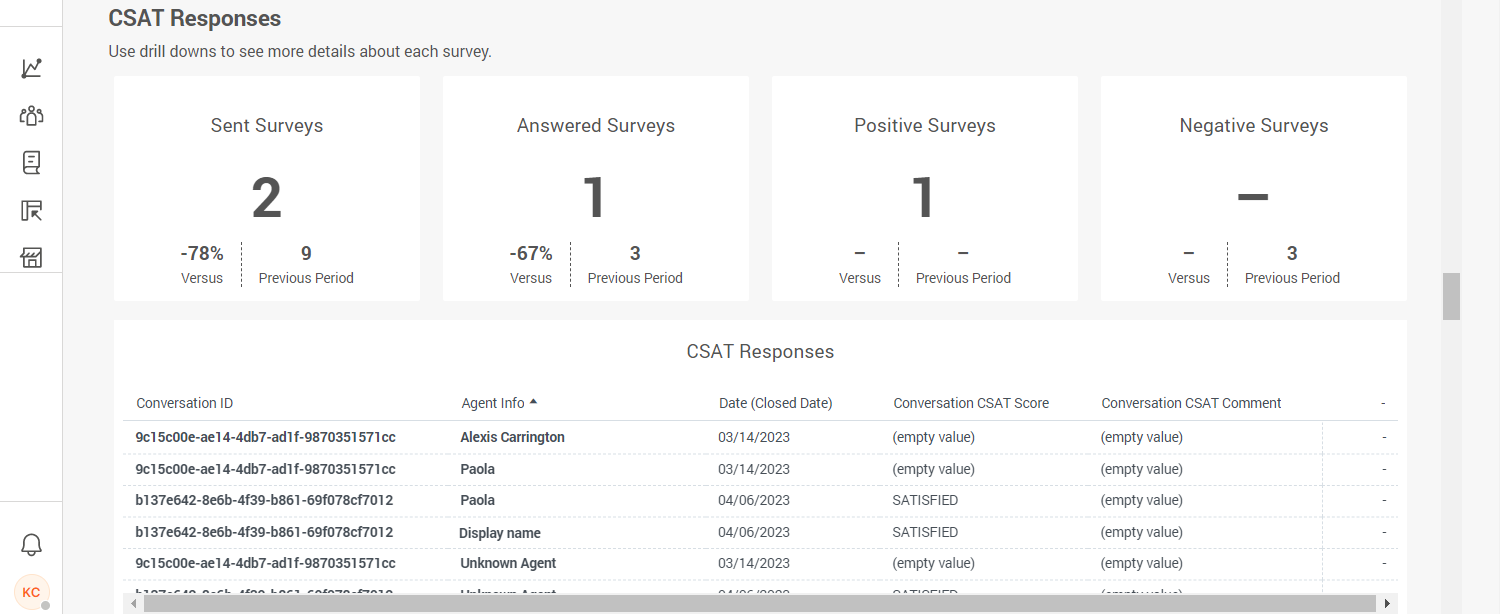
The very last insight on this page shows a list of all survey responses:
- Sent surveys shows the total number of surveys sent to the customers.
- Answered surveys shows all responses from the customers.
- Positive surveys shows the total number of positive responses by the customers.
- Negative surveys shows the total number of negative responses by the customers.
Click on any of the conversation IDs to see full conversation details. Besides the conversation IDs, here you can see the agent who handled that particular conversation, the date the survey was closed, the CSAT score, and comments if there are any for that particular conversation.
Insights
Insights are interactive and multi-layer analytics that enable you to add and slice data based on multiple metrics. These are the most extensive report types. You can use insights either as a standalone report or as part of your custom dashboards.
To access Insights, on the web interface, go to Conversations > Analytics > Insights.
Here, you can do the following:
- View a list of insights.
- Create an insight.
- View details of an insight. Click the information icon against the insight.
- Search for an insight by its partial or complete name.
- Filter insights. Example: by insight type or last updated.
- Sort insights. Use the table headers.
- Export insights.
- Set the number of insights you can view on a single page.

How to use the editor
You can use the Insights editor to do the following:
- Create an insight
- View a list of insights
- Export an insight
To access the editor, if you are already in the Conversations Analytics section > navigate to the Insights tab. Click Create Insights.

- Data catalog: Contains facts, metrics, and attributes. Expand the menu items to view the data items you can use.
- Facts: Quantitative data that you can add to the insight.
- Metrics: Quantitative data that you can add to the insight.
- Attributes: Qualitative data that you can add to the insight.
- Filter options for the data catalog: Click the relevant data type (metrics, facts, and attributes) to view a list of data items of that type.
- Search: Type the partial or full name of a data item to search for it.
- Insight type: Change the chart type depending on your requirements. The system recreates the insight to match the selected type. Each chart type may support specific types of data.
Example: The Stack by field is available for a column chart but not for a table - Active zones: Drag and drop items from the data catalog to these areas of the canvas. The editor provides guidance about the supported data items for each active zone.
- Ad hoc metrics: Use basic arithmetic functions to create these metrics. Click on the + sign to add more metrics.
- Filter: Filter the insight based on specific criteria. To filter, drag and drop the Date or any attribute from the data catalog to this field. Alternatively, click the filter button and select the required attributes. The editor displays a message if there is any data that cannot be filtered.
- Sort: Sort the data in your insight alphabetically, numerically, or chronologically. Sorting is available for bar charts, column charts, area charts, combo charts, bullet charts, pie charts, donut charts, and heatmaps.
- Undo, Redo, and Clear: Undo or redo your changes. Click Clear to remove all data from the insight
- Open: View an insight. You can filter to view a list of only the insights that you created. Alternatively, type the partial or full name of an insight in the Search field
- Save your insight.
- Export: Choose the format to export your insight.
- Configuration: Format the insight. Example: Change colors or position the legend. You may be unable to modify some charts.
Create Insight
Follow these steps to create an insight:
- On the Analytics > Insights tab, click Create Insights.
- Choose an insight type. Each chart type supports specific data types.
- Drag and drop one or more data items (fact, metric, attribute) from the data catalog to the active zones. You can view the data immediately after you add items to the fields. To create a new metric, add at least two data items.
- (Optional)
- To get more detailed data, drag and drop the Date or an Attribute to the Rows/Columns field (only for tables) or to the View by, Trend by, or Attribute fields (for other chart types).
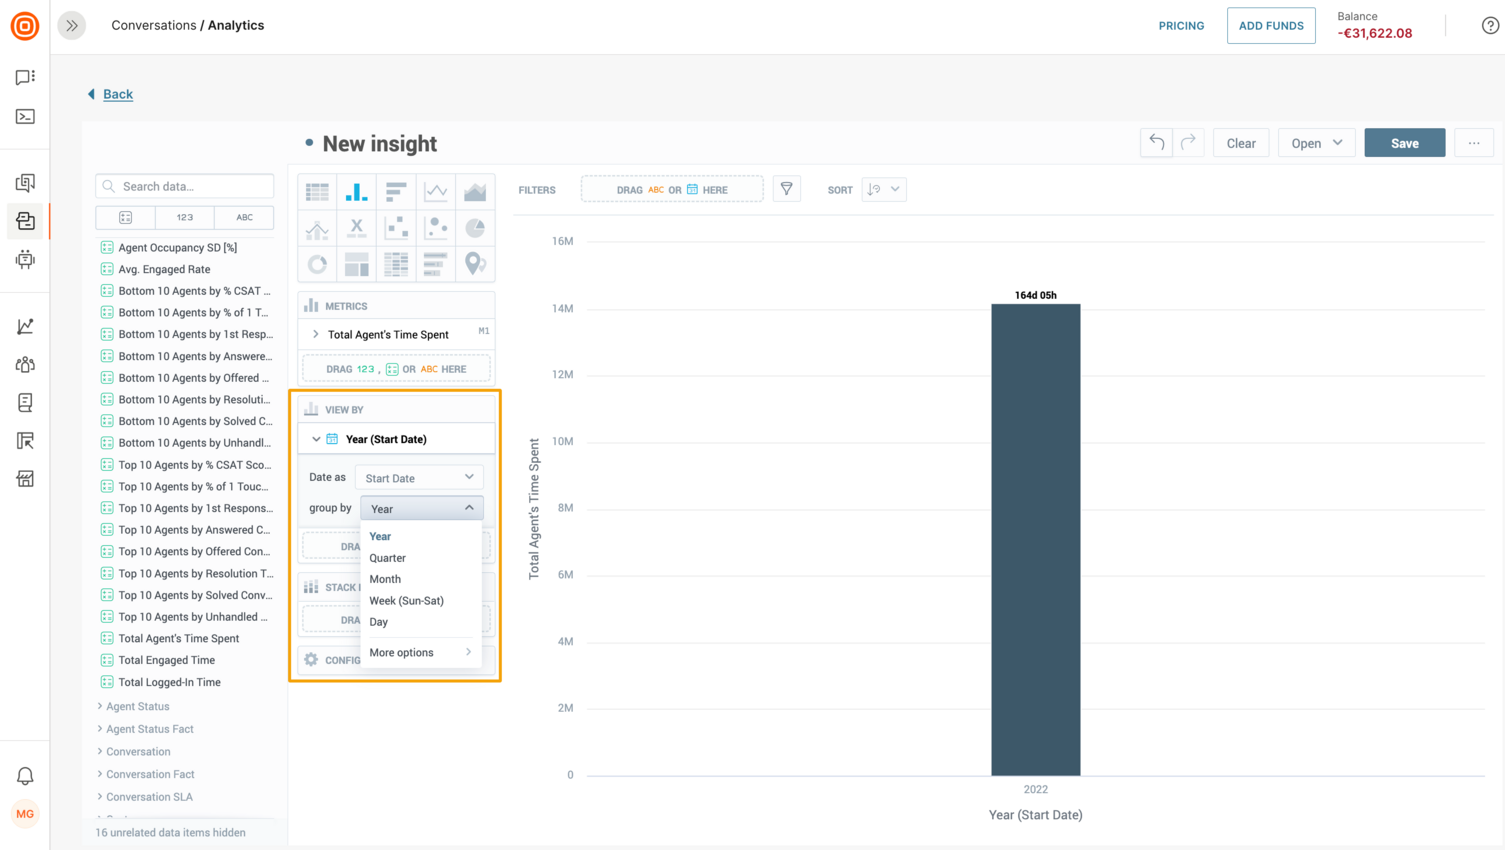
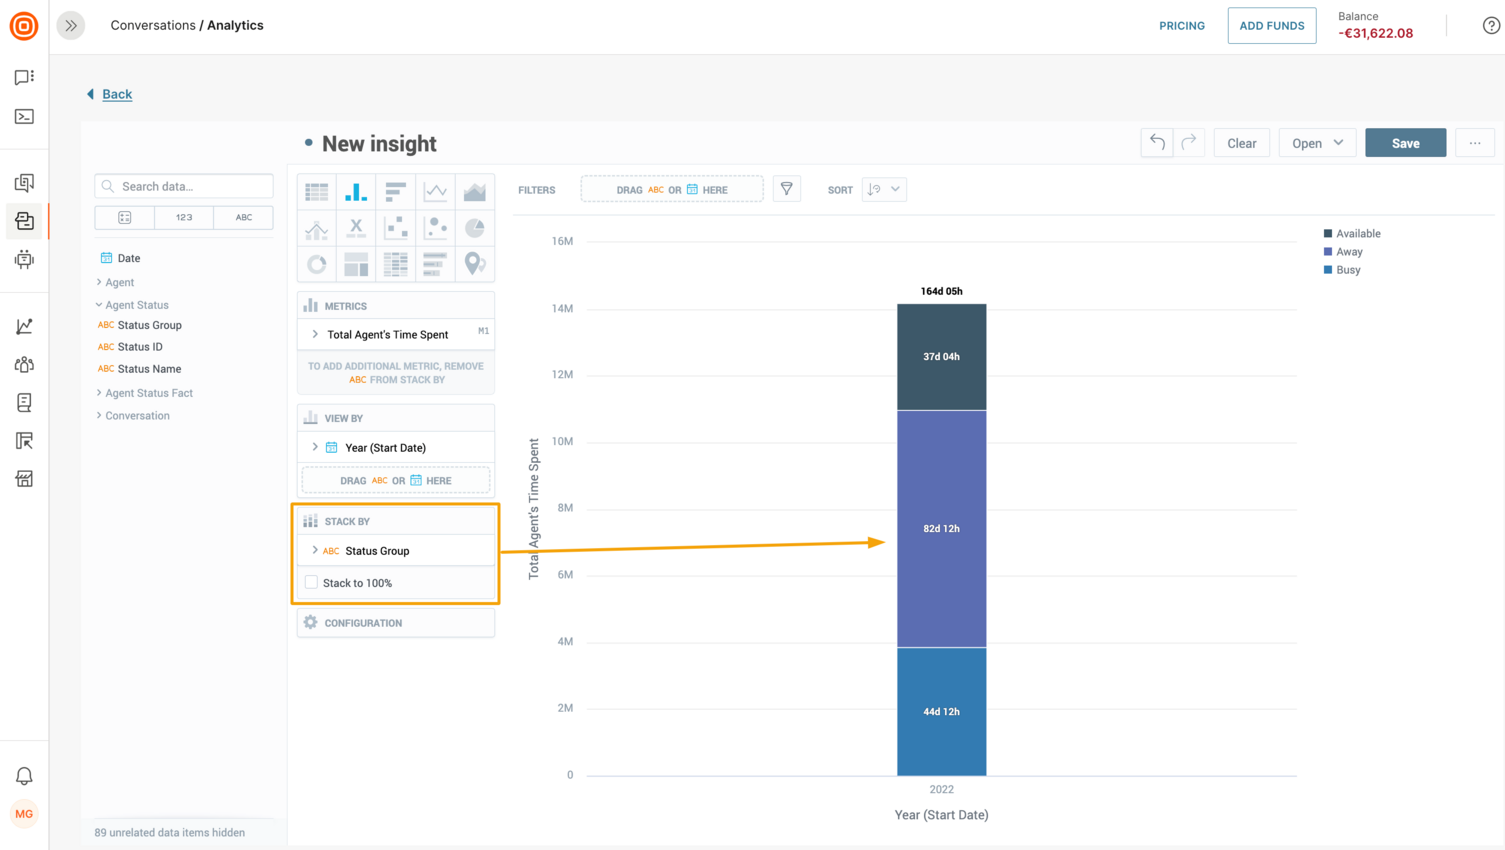
- To split the data into stacked groups, drag and drop an Attribute to the Stack by or Segment by field. For Line charts, there must be only one data item in the Metrics field.
- To format the chart, use the Configuration options.
- To make changes, use the Undo, Redo, and Clear options. To delete a data item, click the item in the editor and drag it to the left.
- Use additional customization options.
- To get more detailed data, drag and drop the Date or an Attribute to the Rows/Columns field (only for tables) or to the View by, Trend by, or Attribute fields (for other chart types).
- Name your Insight.
- Click Save.
Additional Customization Options
Use one or more of the following options to customize your insight further.
Refine Data Items
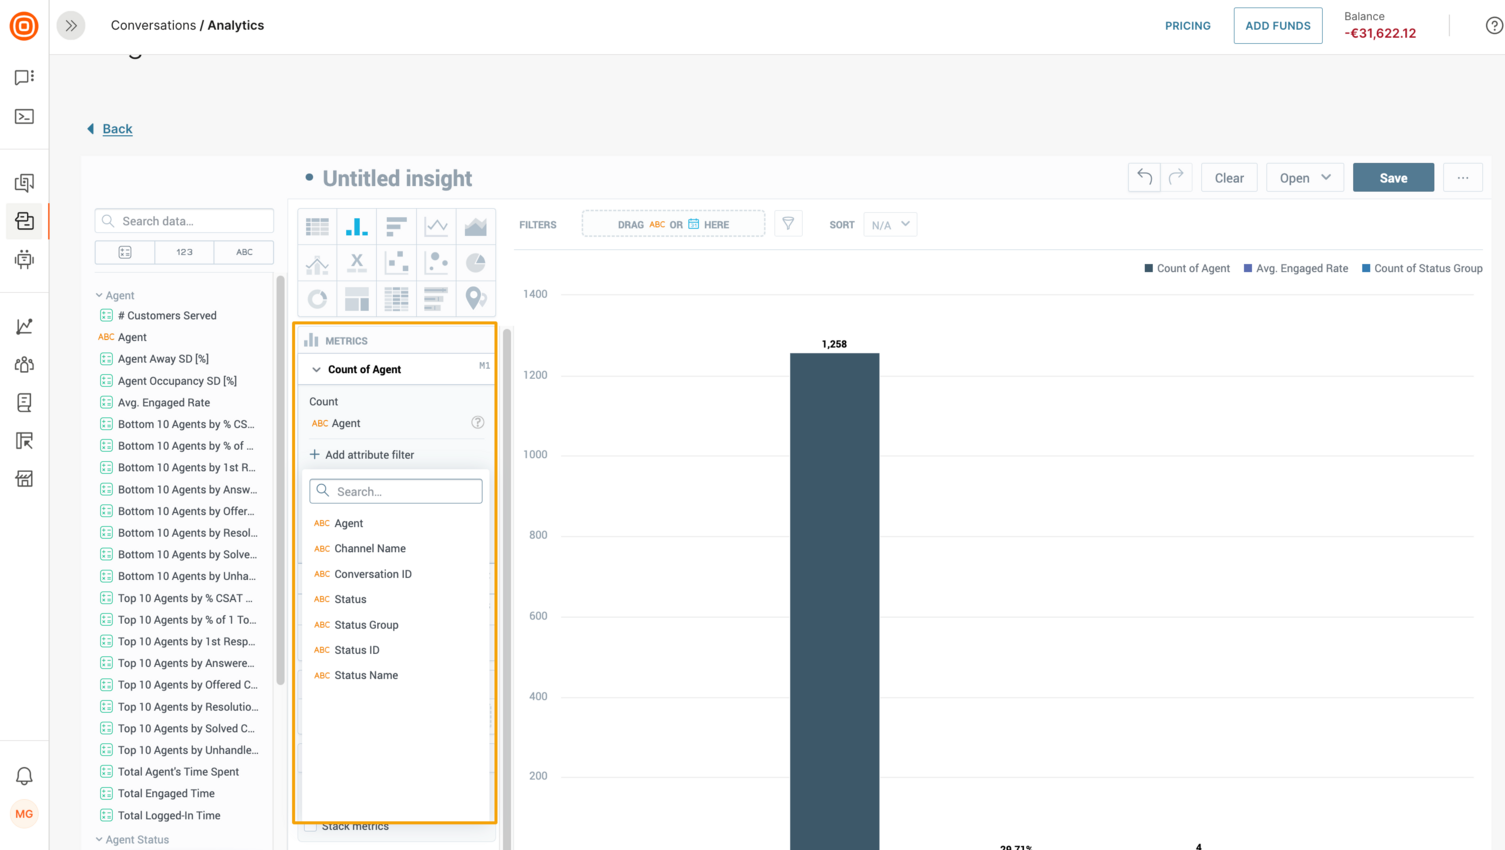
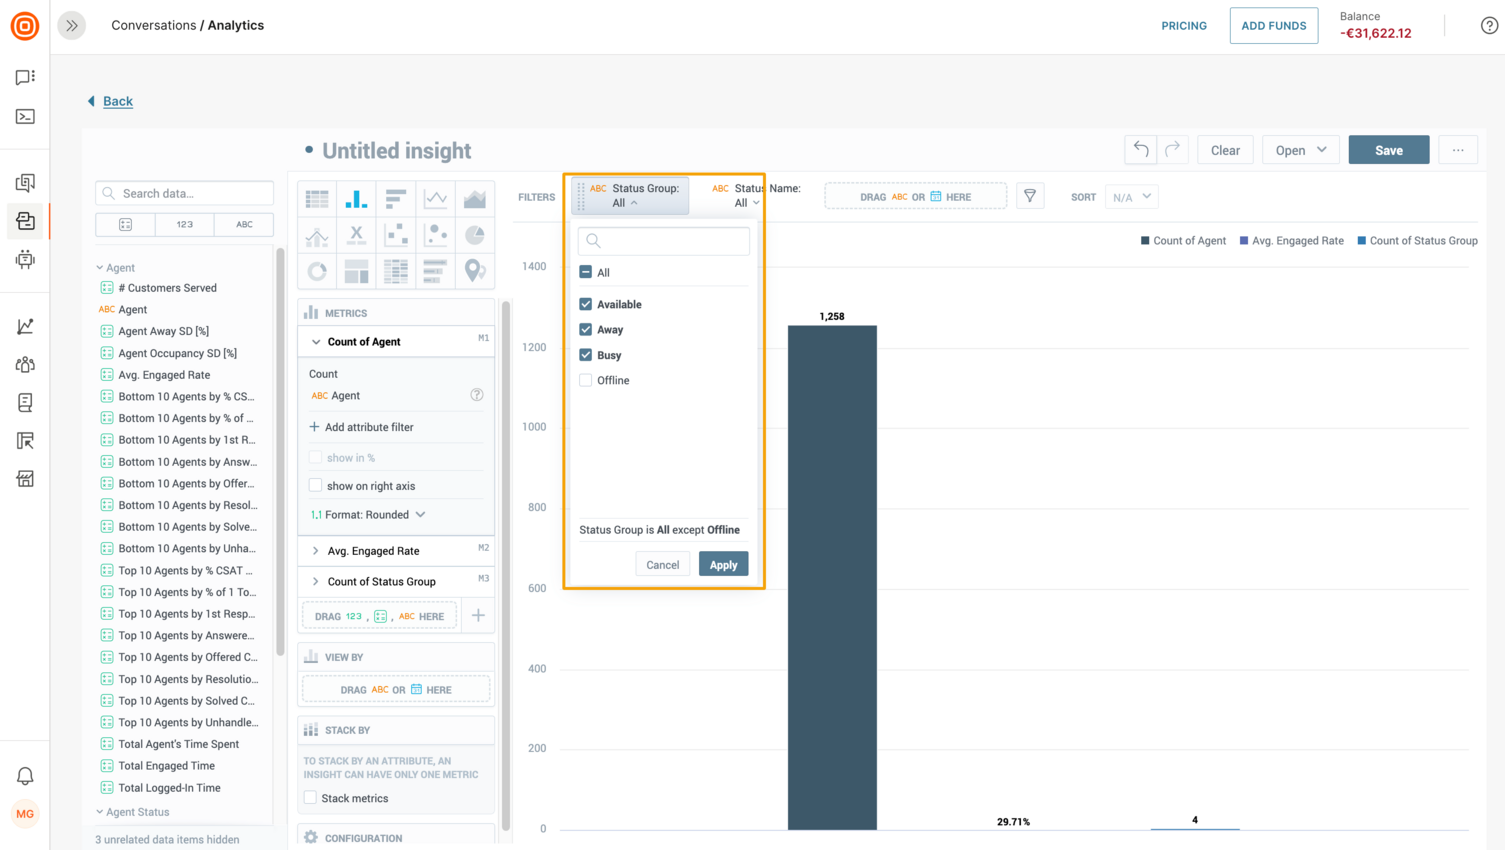
You can refine facts, metrics, and attributes. In the Metrics section, click the +Add attribute filter button to add more attributes to your insight. All filters that you add are applied immediately.
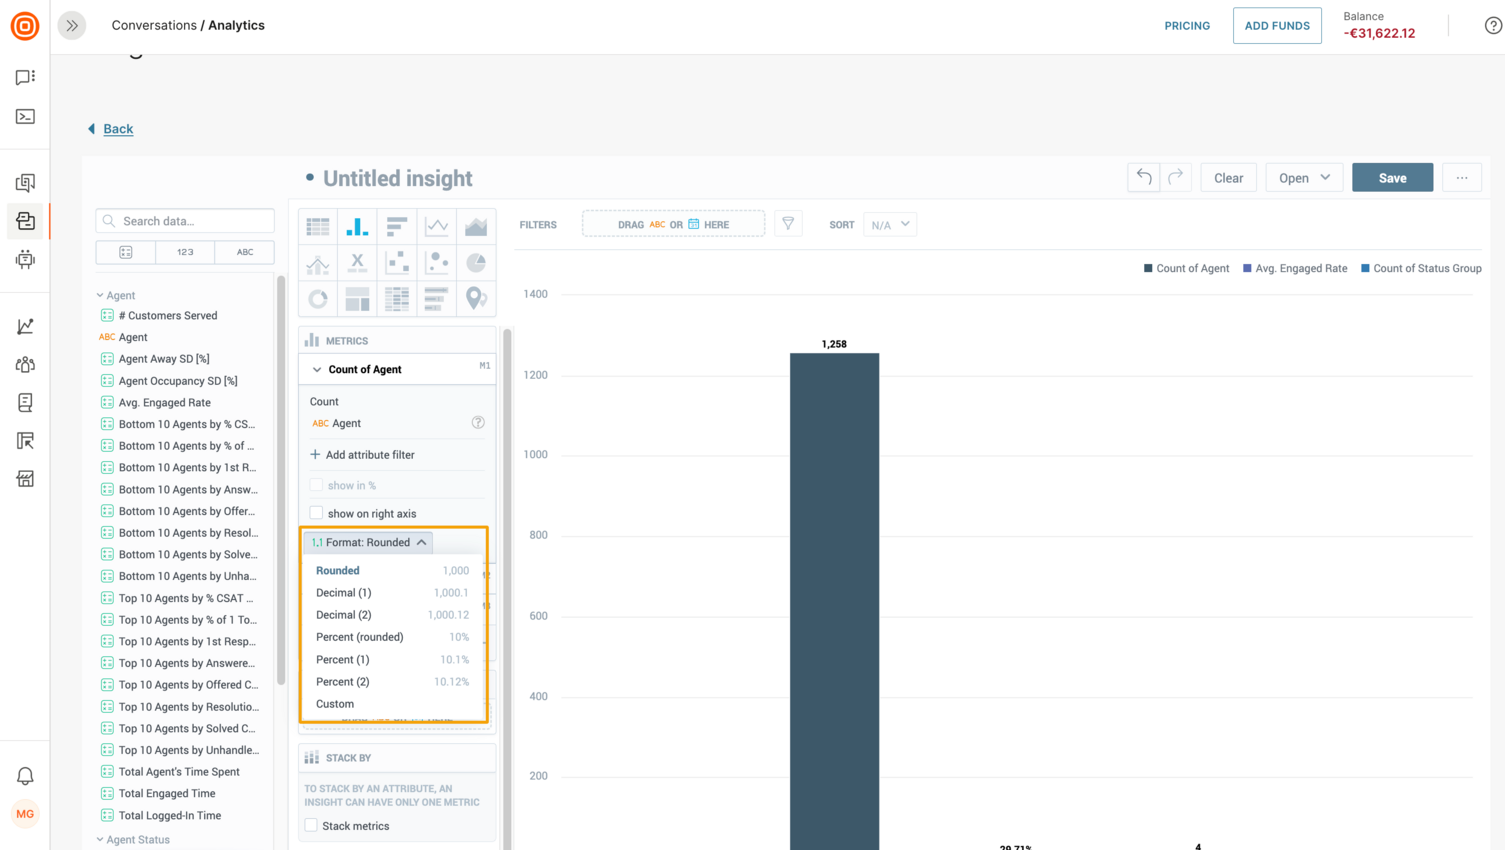
While you are at it, you can also do the following:
- Display this filter as a percentage
- Format the data values
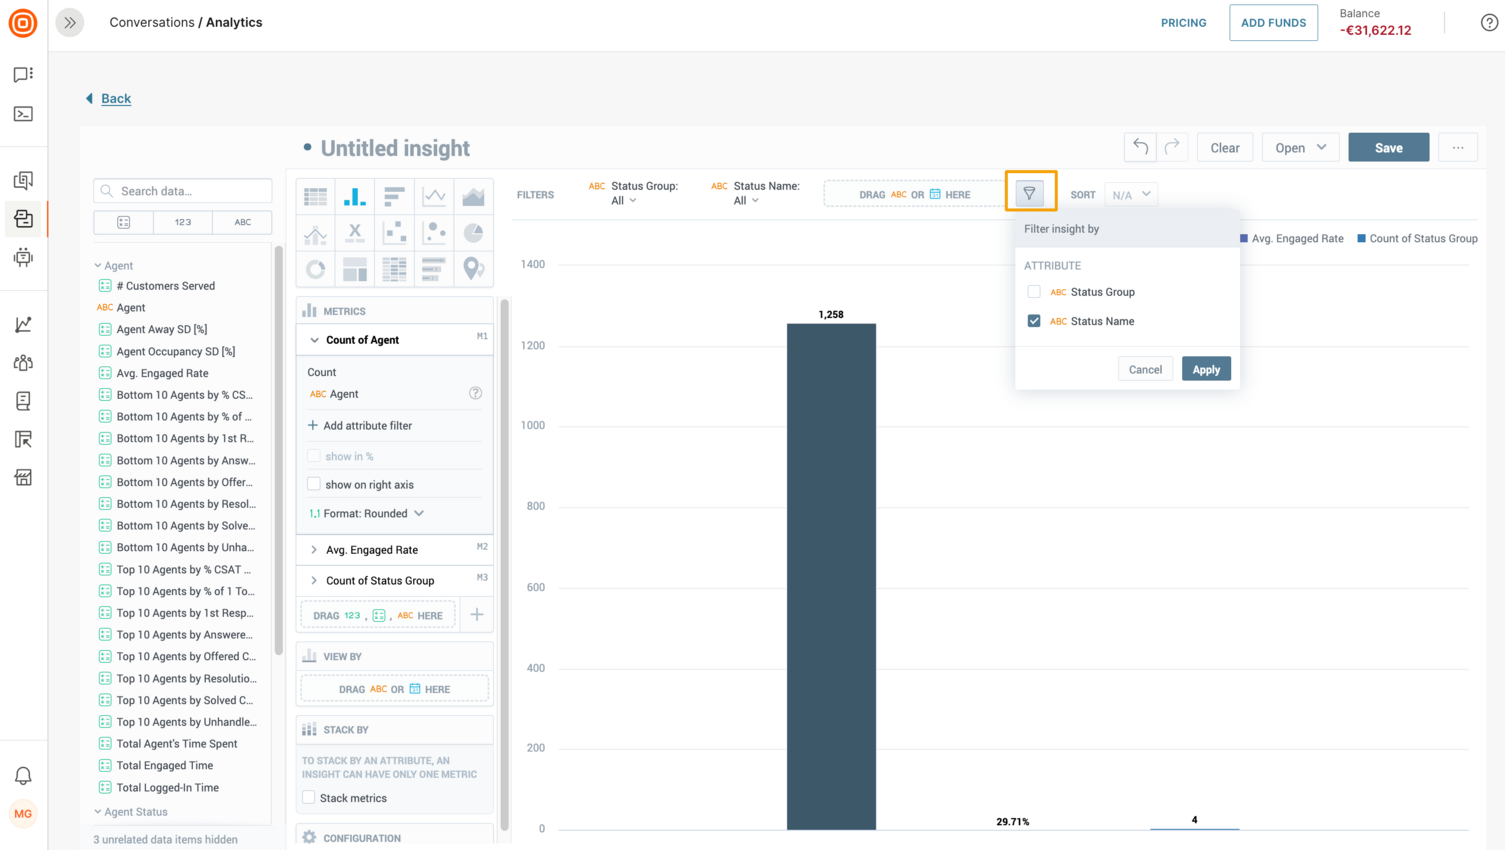
Add Filters to the Insight
This section is for filtering the insight. For details about filtering the Attribute section, refer to the Refine Data Items section which is just above this section.
To filter the insight, drag and drop the Date and other attributes to the Filter at the top.
 (Optional) Click the item added to the Filter and choose the needed options.
(Optional) Click the filter icon and choose the filters you wish to apply.
Export Insight
On the Insights tab, click the three dots against an insight and choose one of the following file formats:
- .csv
- .xls
The insight is downloaded as a static file.

Custom dashboards
Dashboards are visual representations of data. Create custom dashboards to obtain specific, relevant information about the performance of your conversations or agents. You can do the following:
- Track changes to your KPIs
- Compare current data across time periods
- Add, slice, and filter data
- Set alerts when there is a change in a KPI
The dashboards contain one or more of the following components.
- Insights: Multi-layer analytics that allow you to add and slice data based on multiple metrics.
- Key Performance Indicators (KPIs): Mono-layer analytics that display a single metric in numeric format. KPIs can be a whole number, decimal number, or a percentage.
- Attribute filter: Additional filters that you can add to the standard filtering options to filter reports by specific Conversations components. These filters are predefined and are based on the standard Conversations fields.
Dashboards can contain more than one item of the same type. Example: multiple insights.
All the elements on the dashboard must together fulfil a common purpose.
To access dashboards, if you are already in the Conversations module, click Analytics > Custom Dashboards.
You can do the following:
- View dashboards. By default, the latest dashboard that you created is displayed. To view other dashboards, choose the dashboard from the Custom Dashboards menu.
- Create dashboards. You can either use custom metrics to customize an existing standard report or create a new custom dashboard from scratch.
- Edit dashboards.
- Export dashboards. Supported file type is .pdf.
- Share dashboards with other people within your organization.
Create dashboard from existing standard report
- On a standard report insight. Click the menu button and then click Explore from here.
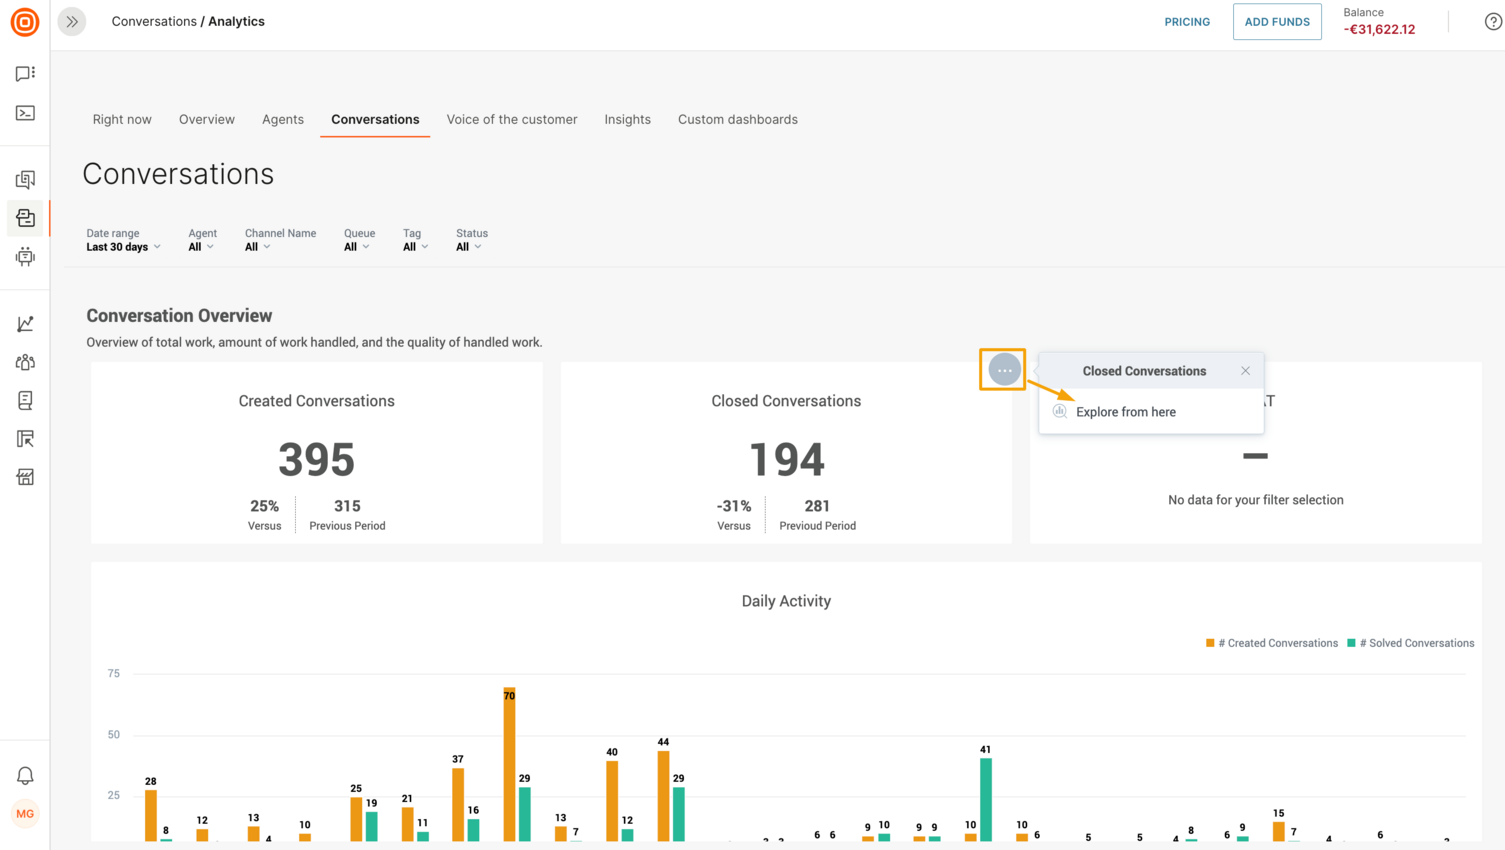
The report opens in the insight editor. For more information about the insight editor, refer to the Insights section. - Add other reporting elements to the editor.
- Click Save.
Create dashboard from scratch
Follow these steps to create a new dashboard:
- Navigate to Conversations Analytics > Custom dashboards > and in the drop-down menu, click Add dashboard.
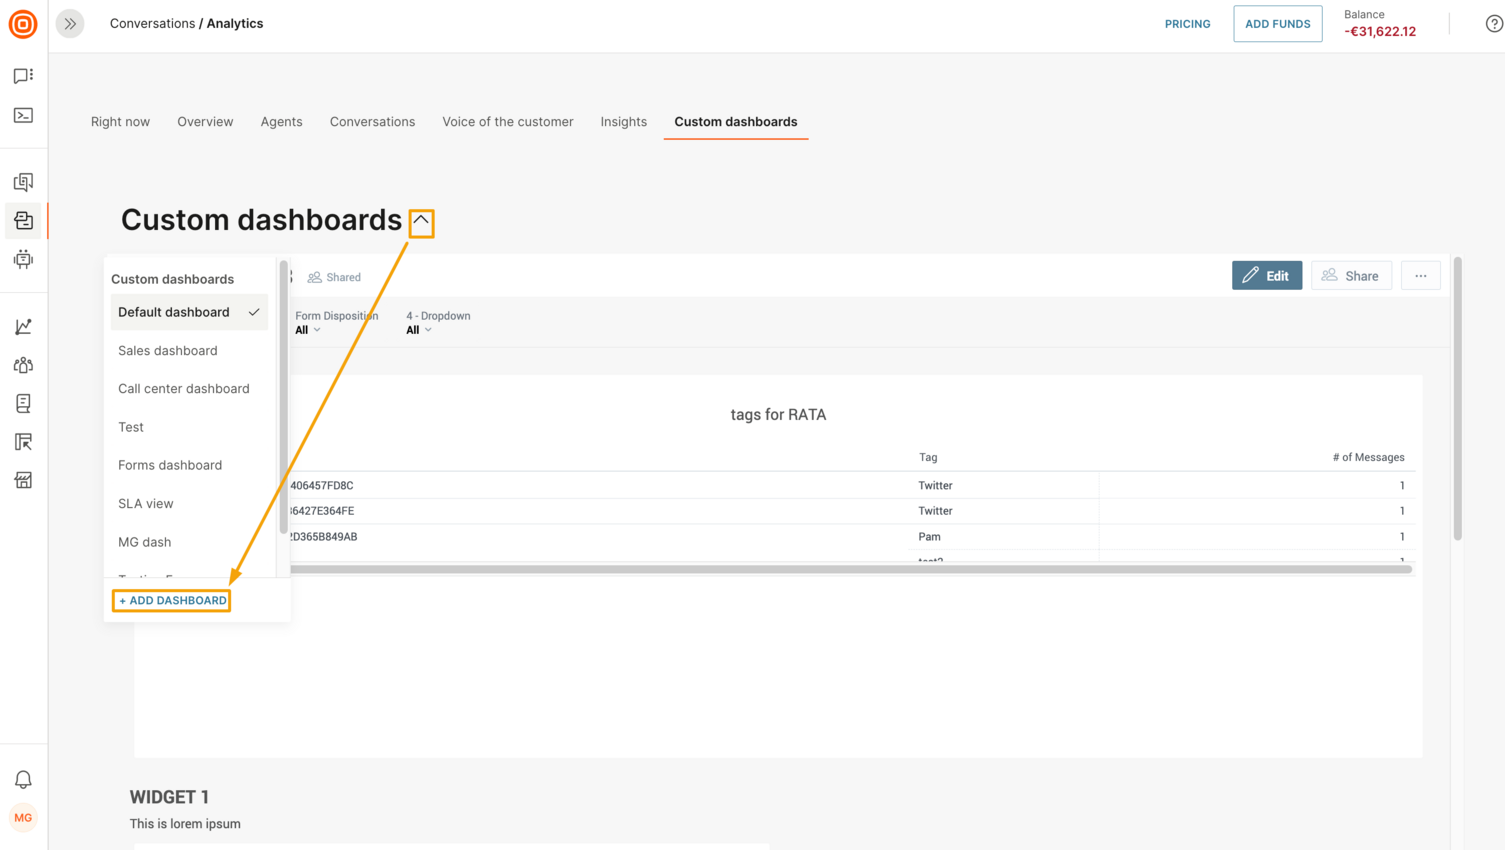
- Enter the dashboard name. Choose one of the following dashboard availability options:
- Public: Accessible by everyone who has access to Conversations Analytics
- Shared: Shared with specific users or groups
- Private: Accessible only to the creator of the dashboard
- Click Create.
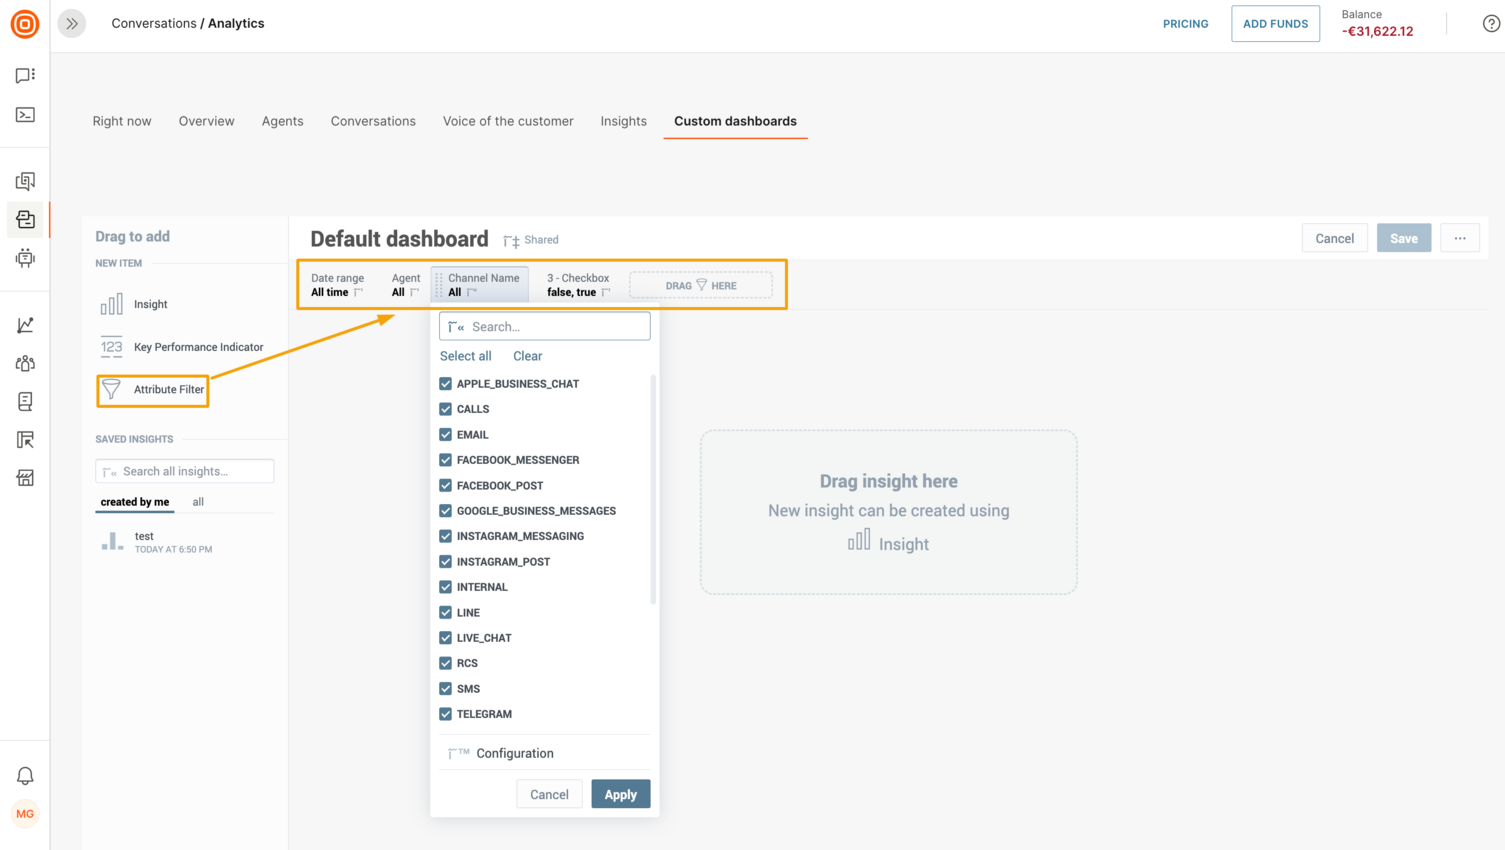
- Drag and drop one or more of the following items to the dashboard editor. You can also add more than one item of the same type. Example: multiple attributes. The editor provides guidance about where you can add each of these items.
- Attribute Filter: After you add the Attribute Filter element, search for or choose an attribute from the list. Example: the channel name, CSAT score. For each attribute, choose the values to filter. By default, all values are selected. You can add or edit these filters at any time, for example, if there are new reports.
- Key Performance Indicator: After you add the KPI element, search for or choose a metric from the list. Example: session duration, new users.
You can also do the following:- Filter by date or by one or more attributes. Choose an attribute in the Filter by section.
- Compare data between time periods. Choose the time period in the Comparison section. You can also choose whether to display the result in green or red color.
- Drill into a specific dashboard. Choose an existing dashboard in the Drill into dashboard section. When your custom dashboard is ready, you can click the KPI to view the selected dashboard.

- Set Alerts for KPI Changes: After you save the dashboard, you can set up email notifications for KPI changes. For more information, refer to the Alerts section.

- Insight: Create a new insight to display results by multiple data types. For more information, refer to the Insights section.
- Saved Insights: Search for an insight or choose an existing one from the list to display results by multiple data types. You can add insights that you created or those that are shared with you.
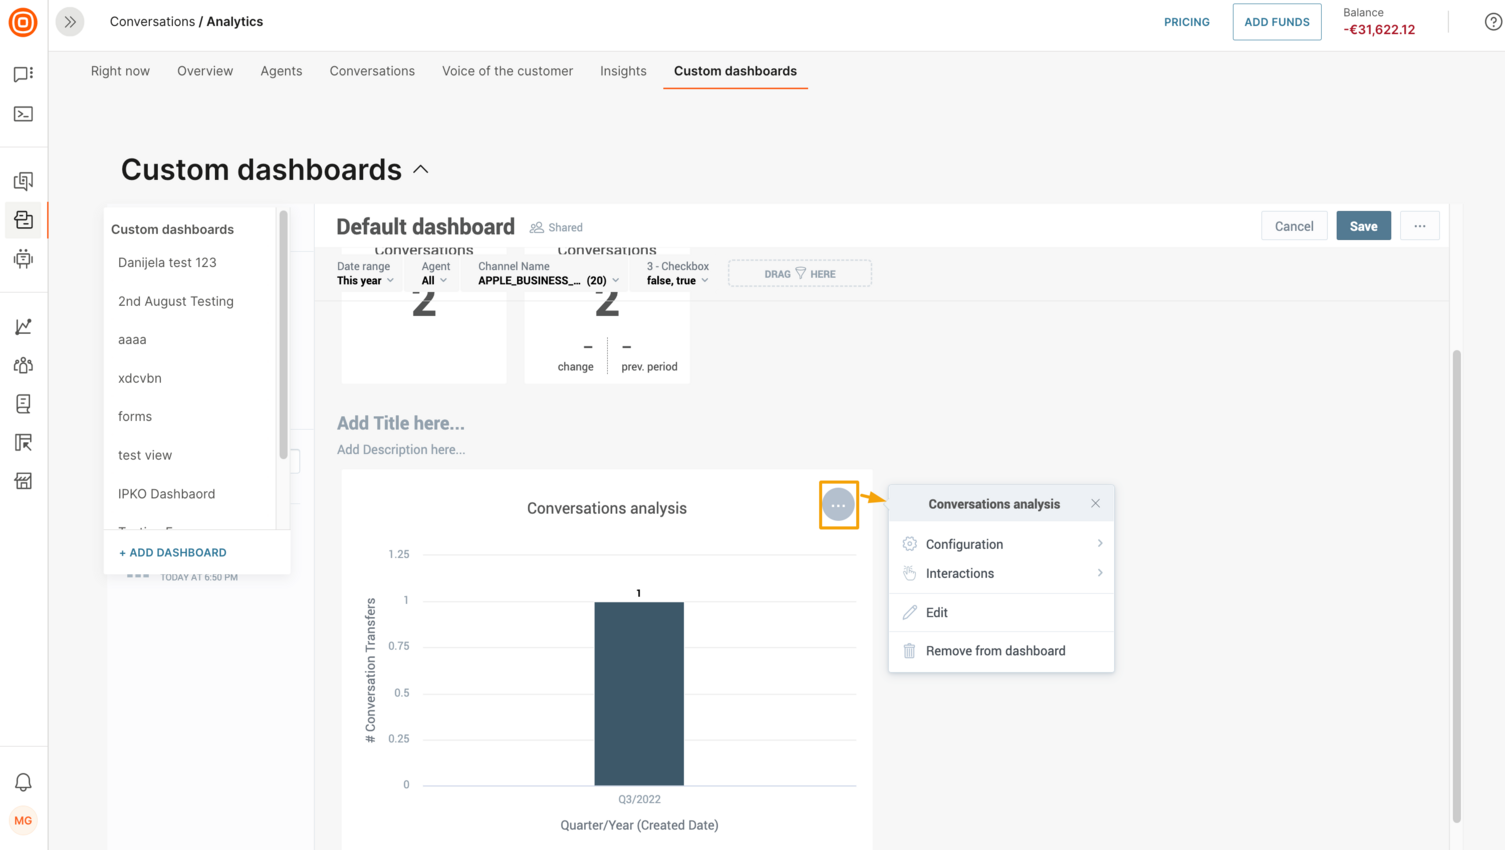
After you add the insight, click the insight to view the menu options. You can do the following:- Add filters or hide the insight title: Click Configuration
- Make changes: Click Edit
- Enable zoom option for the insight: Click Interactions > Zoomable insight.
- Drill into data. For more information, refer to the Drill into Data section.
- Attribute Filter: After you add the Attribute Filter element, search for or choose an attribute from the list. Example: the channel name, CSAT score. For each attribute, choose the values to filter. By default, all values are selected. You can add or edit these filters at any time, for example, if there are new reports.
- Add titles and descriptions for each section.
- (Optional) To configure or delete a KPI or Insight, click the item to get the menu options, and then click Remove from dashboard. To delete an attribute filter, click the item and drag and drop it to the left.

- Click Save.
Drill into data
After you add an insight to the dashboard, you configure drilling for the insight. You cannot drill into a KPI.
You can drill into the following:
- Insight
- Dashboard
- URL
After you configure the drilling, when you click on a fact, metric, or attribute in the View mode, the target insight, dashboard, or URL opens.
You can configure multiple drilling options for the same insight. Example: You can configure drilling into an insight and a dashboard.
To configure drilling:
- Click the insight to view the menu options.
- Click Interactions > Drill Interactions > Add interaction.
- Choose the data item for which you want to drill.

- In the I want to section, choose whether you want to drill into the insight, another dashboard, or a URL.
- Drill into dashboard: Choose an existing dashboard. You can choose dashboards that you created or those that are shared with you.
- Drill into insight: Choose the insight to which you want to drill. You can choose insights that you created or those that are shared with you.
- Drill into URL: Either choose an existing URL or create a custom URL.

- Click Save.
To view the results:
- On the dashboard, go to the insight.
- Click the item into which you want to drill. Then, click an item in either the Drill down or Drill into sections.

Alerts
Set up alerts to receive an email notification when a KPI value crosses the specified threshold.
You can add alerts only to KPIs and not to other components, such as insights.
To add an alert to a KPI:
- Go to the Custom Dashboards tab.
- Choose the required dashboard.
- Hover over the KPI for which you want to add an alert.
- Click the bell icon.
- Set the following parameters:
- Choose whether to receive the notification when the KPI value is above or below the threshold.
- Enter the threshold value.
- Click Set alert.
You will now receive alerts to the email address associated with your Infobip account.
Metrics
This section describes the metrics that are available for custom insights and custom dashboards.
Metrics are numeric data that are calculated based on occurrences. Depending on the context in which we utilize the metric, its usage may alter. A certain metric can be used in a combination with different attributes.
For example, the metric First Response Time can be observed at the level of the Conversation, and you can use it for the agent, as well as determine the performance of the Channel, Queue, Tag, or any other attribute it is in correlation with.
The following table lists each metric's purpose as well as the formula used to calculate it.
| Title | Description | Formula | Related object |
|---|---|---|---|
| 1 Message Conversations | The number of conversations that have at least 1 agent reply. | select sum (select count(Conversation ID, Records of Conversation Fact) by Conversation ID where # Agent's Messages = 1) | Conversation |
| 2 Message Conversations | The number of conversations that have 2 agent messages. | select sum (select count(Conversation ID, Records of Conversation Fact) by Conversation ID where # Agent's Messages = 2) | Conversation |
| 3 Message Conversations | The number of conversations that have 3 agent messages. | select sum (select count(Conversation ID, Records of Conversation Fact) by Conversation ID where # Agent's Messages = 3) | Conversation |
| 4 Message Conversations | The number of conversations that have 4 agent messages. | select sum (select count(Conversation ID, Records of Conversation Fact) by Conversation ID where # Agent's Messages = 4) | Conversation |
| 5 Message Conversations | The number of conversations that have 5 agent messages. | select sum (select count(Conversation ID, Records of Conversation Fact) by Conversation ID where # Agent's Messages = 5) | Conversation |
| 6+ Message Conversations | The number of conversations that have more than 6 agent messages. | select sum (select count(Conversation ID, Records of Conversation Fact) by Conversation ID where # Agent's Messages > 5) | Conversation |
| Agent Away (%) | The percentage of time the agent spent in the Away status. | Select (Select SUM(Duration (Agent State)) where Status Group = Away) / (Select SUM(Duration (Agent State))) | Agent |
| Agent Engaged Rate | The ratio of time that an agent spent engaged versus the time they spent logged in. | SELECT Total Engaged Time / Total Logged-In Time | Agent |
| Agent First Response Time | The median first response time of an agent. Time measured from the first assignment till the first message from the same agent. | SELECT LN(Avg. Agent 1st Response Time) | Agent |
| Agent First Response Time (Last Status) | The first response time of an agent. Adjusted metric to filter only the last conversation status. | SELECT (SELECT Avg. Agent 1st Response Time by Conversation ID all other) * Last Status Flag | Agent |
| Agent Occupancy (%) | The percentage of time the agent spent in the Available and Busy status groups. | SELECT (Select SUM(Duration (Agent State)) where Status Group IN (Available, Busy)) / (select sum(Duration (Agent State))) | Agent |
| Agent Total Engaged Time | The median time that the agent spent while engaged in a conversation. (Engaged time is the time agents spend dealing with the customer.) |
Select SUM(Duration (Agent State)) where Status Name in (Full capacity, Full capacity (mobile), In a call, Ringing, Under capacity, Under capacity (mobile), Wrapping) | Agent |
| Agent Total Logged-In Time | Median time that the agent spent logged in to the system. | Select SUM(Duration (Agent State)) | Agent |
| Assigned Conversations | The number of conversations offered to an agent. Adjusted metric to also include agents with no conversations in the agent overview dashboard. | SELECT ifnull(# Offered Conversations,0) + 0*# Agents in Conversations/ifnull(# Offered Conversations,0) | Agent |
| Average Conversation Resolution Time | The average resolution time per conversation. | SELECT MEDIAN(SELECT SUM(Resolution Time) BY Conversation ID) | Conversation |
| Average Conversation Sentiment | The average sentiment per conversation. | SELECT MEDIAN(Last Sentiment) BY Records of Conversation Fact | Conversation |
| Average Number of Agent's Messages | The average number of an agent’s messages within a conversation. | SELECT SUM(SELECT MIN(SELECT MIN(SELECT Agent Messages by Conversation ID) by Records of Conversation Fact) by Conversation ID) / # Conversations | Message |
| Average Number of Customer's Messages | The average number of customer messages within a conversation. | SELECT SUM(SELECT MIN(SELECT MIN(SELECT Customer Messages by Conversation ID) by Records of Conversation Fact) by Conversation ID) / # Conversations | Message |
| Average Number of Messages | The average number of messages per conversation. | SELECT ifnull(Avg. # Agent's Messages,0) + ifnull(Avg. # Customer's Messages,0) | Message |
| Average Waiting Time per Hour Bucket | The average waiting time per conversation grouped in one hour bucket. Only conversations created in the last 30 days are taken into account. | SELECT AVG(SELECT SUM(Duration) BY Conversation ID,Start Time Hour WHERE Status in (WAITING) and Date (Created Date) >= THIS - 30) | Conversation |
| Conversation CSAT Score (%) | The CSAT score of conversations. | SELECT (SELECT COUNT(Conversation ID,Records of Conversation Fact) WHERE CSAT Score = (deleted value))/(SELECT COUNT(Conversation ID,Records of Conversation Fact) WHERE CSAT Score IN ((deleted value),(deleted value))) | Conversation CSAT |
| Conversation Resolution Time (Last Status) | The total resolution time per conversation. Metric is adjusted to filter only the last conversation status. | SELECT (SELECT SUM(Resolution Time) by Conversation ID all other) * Last Status Flag | Conversation |
| Conversation Survey Sent | The number of sent surveys. | SELECT COUNT(Conversation ID,Records of Conversation Fact) WHERE Survey Sent Flag = (deleted value) | Conversation |
| Conversations with Agent Message | The total number of conversations that have at least one agent message. | select sum (select count(Conversation ID, Records of Conversation Fact) by Conversation ID where # Agent's Messages > 0) | Conversation |
| Conversations with SLA Breach | The number of conversations with at least one SLA Breach event. | SELECT Number of Conversations WHERE (SLA - First Response Time Breached > 0 or SLA - Next Response Time Breached > 0 or SLA - Resolution Time Breached > 0) AND SLA Policy <> (empty value) | Conversation SLA |
| Conversations with SLA Next Reply Time Breach | The number of conversations with at least one SLA Next Reply Time Breach event. | SELECT COUNT(Conversation ID,Records of Conversation Fact) where SLA - Next Response Time Breached > 0 | Conversation SLA |
| First Response Time | The median first response time per conversation. | SELECT MEDIAN(SELECT Total First Response Time BY Conversation ID WHERE First Response Time > 0) | Conversation |
| First Response Time (Last Status) | The first response time per conversation. Metric is adjusted to filter only the last conversation status. | SELECT (SELECT 1st Response Time by Conversation ID all other) * Last Status Flag | Conversation |
| Median Conversation First Resolution Time | The median first resolution time per conversation. | SELECT MEDIAN(SELECT SUM(First Resolution Time) BY Conversation ID) | Conversation |
| Median Conversation Resolution Time | The median resolution time per conversation. | SELECT MEDIAN(SELECT SUM(Resolution Time) BY Conversation ID) | Conversation |
| Number of Agent Messages per Conversation | The number of messages sent by an agent per conversation. | SELECT SUM(Agent Messages) BY Conversation ID ALL OTHER | Message |
| Number of Agent Messages per Conversation (Last Status) | The number of messages sent by the agent. Adjusted metric to filter only the last conversation status. | SELECT # Agent's Messages * Last Status Flag | Message |
| Number of Agents Assigned to Conversation | The number of agents assigned to a conversation. | SELECT COUNT(Agent,Records of Conversation Fact) | Conversation |
| Number of Answered Conversations | The total number of conversations that have at least 1 agent message. | SELECT # Conversations WHERE # Agent's Messages > 0 | Conversation |
| Number of Assigned Conversations | The number of conversations that were offered to an agent. | SELECT ifnull(# Solved Conversations,0) + ifnull(# Unhandled Conversations,0) | Conversation |
| Number of Closed Conversations | The number of conversations that were closed in the selected period. | SELECT # Conversations WHERE (SELECT MAX(Conversation State) BY Conversation ID, Status ALL OTHER) = (SELECT MAX(Conversation State) BY Conversation ID, Status ALL OTHER WHERE Status IN (CLOSED, SOLVED)) | Conversation |
| Number of Conversation Transfers | The number of assignee changes per conversation. | SELECT SUM(Assigne Change) BY Conversation ID ALL OTHER | Conversation |
| Number of Conversation Transfers (Last Status) | The number of assignee changes per conversation. Adjusted metric to filter only the last conversation status. | SELECT # Conversation Transfers * Last Status Flag | Conversation |
| Number of Conversations | The total number of conversations. | SELECT COUNT(Conversation ID,Records of Conversation Fact) | Conversation |
| Number of Conversations - End of Day | At the end of each day, the conversations are counted and grouped by statuses. Use this metric to display them per day and group by status. |
select count(Conversation ID, Records of Conversation Fact) by Date (Start Date) where Start Time HH:MM = 23:45 and Status <> CLOSED | Conversation |
| Number of Conversations Transferred from Queue | The number of conversations that were transferred from a certain queue. | SELECT SUM(Queue Flow Out Flag) BY Queue ALL OTHER | Queue |
| Number of Conversations Transferred to Queue | The number of conversations that were transferred into a certain queue. | SELECT SUM(Queue Flow In Flag) BY Queue ALL OTHER | Queue |
| Number of Created Conversations | The number of conversations created in the selected period. | SELECT # Conversations WHERE Conversation State = 1 | Conversation |
| Number of Served Customers | The number of customers served by an agent. | SELECT COUNT(Customer) | Customer |
| Number of Solved Conversations | The number of conversations that were marked as solved or closed in the selected period of time. | SELECT # Conversations WHERE (SELECT MAX(Conversation State) BY Conversation ID, Status ALL OTHER) = (SELECT MAX(Conversation State) BY Conversation ID, Status ALL OTHER WHERE Status IN (CLOSED, SOLVED)) | Conversation |
| Number of Unhandled Conversations | The number of conversations that were assigned to an agent and were not solved or closed in selected period. | SELECT # Conversations where Agent <> Unknown Agent and (SELECT MAX(Conversation State) BY Conversation ID ALL OTHER) = (SELECT MAX(Conversation State) BY Conversation ID, Status ALL OTHER WHERE Status IN (OPEN, (deleted value), WAITING)) | Conversation |
| Percentage of 1 Message Conversations | The number of conversations that have 1 agent message. | SELECT 1 Touch Tickets / All Touched Tickets | Conversation |
| SLA - Count of First Response Time Breach | The number of conversations that have breached their First Response Time SLA. | SELECT COUNT(Conversation ID,Records of Conversation Fact) where SLA - First Response Time Breached > 0 | Conversation SLA |
| SLA - Count of Next Reply Time Breach | The number of SLA Next Reply Time Breaches events. | SELECT SUM(SLA - Next Response Time Breached) where SLA - Next Response Time Breached > 0 | Conversation SLA |
| SLA - Count of Resolution Time Breach | The number of conversations that have breached their Total Resolution Time SLA. | SELECT COUNT(Conversation ID,Records of Conversation Fact) where SLA - Resolution Time Breached > 0 | Conversation SLA |
| SLA Achievement Rate | The percentage of the conversations that have met their Service Level Agreement. | SELECT ((SELECT # Conversations WHERE Policy <> (empty value)) - # Conversations with SLA Breach) / (SELECT # Conversations WHERE Policy <> (empty value)) | Conversation SLA |
| SLA Achievement Rate - First Response Time | The percentage of the conversations that have met their Service Level Agreement for First Response Time. | SELECT ((SELECT Number of Conversations WHERE SLA Policy <> (empty value)) - IFNULL(SLA - Count of First Response Time Breach,0)) / (SELECT Number of Conversations WHERE SLA Policy <> (empty value)) | Conversation SLA |
| SLA Achievement Rate - Next Reply Time | The percentage of the conversations that have met their Service Level Agreement for Next Reply Time. | SELECT ((SELECT Number of Conversations WHERE SLA Policy <> (empty value)) - IFNULL(Conversations with SLA Next Reply Time Breach,0)) / (SELECT Number of Conversations WHERE SLA Policy <> (empty value)) | Conversation SLA |
| SLA Achievement Rate - Resolution Time | The percentage of the conversations that have met their Service Level Agreement for Resolution Time. | SELECT ((SELECT Number of Conversations WHERE SLA Policy <> (empty value)) - IFNULL(SLA - Count of Resolution Time Breach,0)) / (SELECT Number of Conversations WHERE SLA Policy <> (empty value)) | Conversation SLA |
| Time Spent in Status | The total duration of the time an agent spent in a status. Use in combination with Status Name and Agent attributes to see the distribution. |
SELECT SUM(Duration (Agent State)) | Agent |
| Total Agent's Messages | The total number of an agent’s messages per conversation. | SELECT SUM(SELECT MIN(SELECT MIN(SELECT Agent Messages by Conversation ID) by Records of Conversation Fact) by Conversation ID) | Message |
| Total Customer's Messages | The total number of customer messages per conversation. | SELECT SUM(SELECT MIN(SELECT MIN(SELECT Customer Messages by Conversation ID) by Records of Conversation Fact) by Conversation ID) | Message |
| Total First Response Time | The total first response time per conversation, | SELECT SUM(First Response Time) by Conversation ID | Conversation |
| Total Messages Inbound | The total number of inbound (customer) messages. | SELECT Total Messages where Direction=INBOUND | Message |
| Total Messages Outbound | The total number of outbound messages. | SELECT Total Messages where Direction=OUTBOUND | Message |
| Total Messages | The total number of messages. | SELECT SUM(Message Count) | Message |
| Number of Notes | The number notes (private messages) within the conversation. | SELECT SUM(Private Messages) | Message |
| Number of Agents per Agent Queue | The number of agents that were assigned to a certain queue, could be used to analyze the presence of the agents in a certain queue per hour (1 Hour Time Window). | SELECT COUNT(Agent Info,Records of Agent Status Fact) | Agent |
| SLA Breaches | The total number of SLA breaches. | SELECT IFNULL(# SLA - First Response Time Breach,0) +IFNULL(# SLA - Next Response Time Breach,0)+ IFNULL(# SLA - Resolution Time Breach,0) | Conversation SLA |
Metrics are organized into groups by related objects in the Insights editor. For example, the Agent Away (%) metric is located under the Agent folder.

The information that is shown in the table can also be viewed in the Insights editor. To see a metric's information, simply hover over the question mark icon next to it.

Alternatively, you may view information about a metric by hovering over the question mark icon next to it once you drag it to the Insights editor.

Attributes
The key characteristics of the platform's main items are described by their attributes. They have an essential function in data analytics and are used to improve decision-making, optimize processes and identify trends.
The following table provides each attribute's purpose for custom insights and custom dashboards.
| Title | Description | Related object |
|---|---|---|
| 1 Hour Time Window | A 1-hour time window that can be used for analysis of certain objects. Example: Track agent status changes in a 1-hour time window during the day. |
Time Dimension |
| 15 Minute Time Window | A 15-minute time window that can be used for analysis of certain objects. Example: Track agent status changes in a 15-minute time window during the day. |
Time Dimension |
| Agent Info | Agent name or unique ID. | Agent |
| Agent Queue | The queues each agent was receiving conversations in. Show either queue name or queue ID. | Agent |
| Agent Role | The role of an agent. | Agent |
| Agent Status Group | Grouping of agent statuses (Available, Busy, Away, Unavailable). | Agent |
| Agent Status ID | ID of a specific agent status. | Agent |
| Agent Status Name | Agent status with both predefined and custom statuses. | Agent |
| Conversation Closed Time (HH:MM) | Timestamp of the closure of the conversation. If the conversation was closed on February 14 at 17:10, the value of this would be 17:15. | Conversation |
| Conversation Closed Time (HH) | The exact hour when the conversation was closed. If the conversation was closed on February 14 at 17:10, the value of this would be 17. | Conversation |
| Conversation Created Time (HH:MM) | Timestamp of the start of the conversation. If the conversation started on February 14 at 17:10, the value of this would be 17:10. | Conversation |
| Conversation Created Time (HH) | Timestamp of the start of the conversation. If the conversation started on February 14 at 17:10, the value of this would be 17. | Conversation |
| Conversation CSAT Comment | The comment customer provided in the conversation survey. | Conversation |
| Conversation CSAT Score | The score customer provided to the conversation survey. | Conversation |
| Conversation Form | The form that was assigned to the conversation when it was closed. | Conversation |
| Conversation ID | The unique conversation ID. Use this attribute in ROWS to see all the conversations listed by their ID. Use this attribute in METRICS to see the count of all conversations. |
Conversation |
| Conversation Initial Priority | The initial priority assigned to the conversation when it was created. | Conversation |
| Conversation Initial Sentiment | The initial sentiment assigned to the conversation when it was created. | Conversation |
| Conversation Last Priority | The priority the conversation had when it was closed. | Conversation |
| Conversation Last Sentiment | The sentiment of the conversation when it was closed. | Conversation |
| Conversation Queue | All the queues that a conversation was a part of in its life cycle. | Conversation |
| Conversation SLA Metric breached | The list of breached SLA timers. Each timer that gets breached will be listed here for a given conversation. | Conversation SLA Metric Breached |
| Conversation SLA Strategy | The last SLA strategy that was applied to the conversation. | Conversation |
| Conversation Status | Conversation status. | Conversation |
| Conversation Survey Sent | The value that provides info about the survey being sent. | Conversation |
| Conversation Tag | The tags applied to the conversation. | Conversation |
| Conversation Title | The title of the conversation. | Conversation |
| Conversation Topic | The topic of the conversation. | Conversation |
| Customer Info | Information about the customer. Includes ID, name, or stored value from People, the customer data platform. | Customer |
| Customer's Company Country | The country of origin for company. | Customer |
| Customer's Company Industry | The industry a company belongs to, based on their primary business activity. | Customer |
| Customer's Company Name | Full company name. | Customer |
| Customer's Company Region | Company region. | Customer |
| Customer's Company Segment | Customer's Company Segment. | Customer |
| Message Direction | The direction of the message (inbound or outbound). | Message |
| SLA Policy | The Service Level Agreement (SLA) policy applied to the conversation. | Conversation SLA |
| Channel Category | The category of channel. Each channel fits into one channel category based on the synchronicity of the channel. | Channel |
| Channel Name | The name of the communication channel. | Channel |
Attributes are organized into groups by related objects in the Insights editor. For example, the Agent Info attribute is located under the Agent folder.

The information that is shown in the table can also be viewed in the Insights editor. To see an attribute's information, simply hover over the question mark icon next to it.

Alternatively, you may view information about an attribute by hovering over the question mark icon next to it once you drag it to the Insights editor.

Reports
These reports offer detailed information about various Conversations entities such as:
- Conversations
- Conversation transcript
- Queues
- Surveys
- Channels
- Tags
- Agents:
- Utilization
- Performance
You can get your report on the Reports page and send it automatically to your colleagues so that anyone with the link can download it. The link will be valid until the report expires.
One type of report offers information about conversations and their attributes in a given time period.
The conversation report provides information about your conversations created in a given time period and the state of their attributes in the present time.
To create this report, follow the steps below:
-
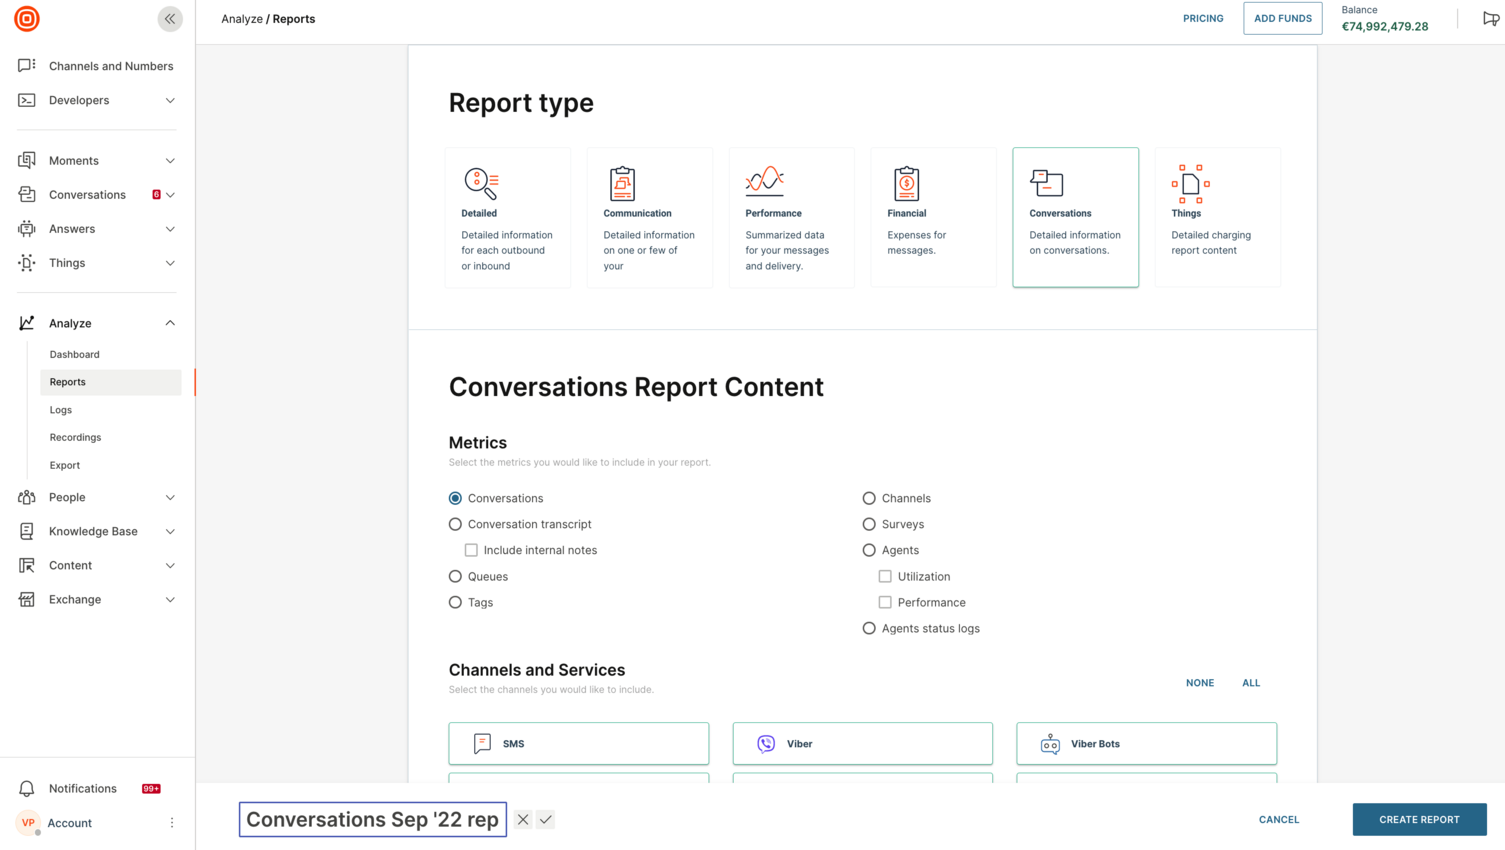
Navigate to Analyze > Reports > CREATE REPORT
-
Choose the Conversations Report type and select the entity you want to track. Depending on the selected entity you can configure additional filtering.
-
Select the date range for the report and options such as file format, recurrence, or the recipients to whom you want to send the report.
-
Click CREATE
Conversations
Conversations report provides detailed insight into each conversation that occurred in a defined period.
The report consists of the following fields:
| Field | Description | Example |
|---|---|---|
| Account ID | Unique account ID. | 112233 |
| Account Name | The name of the selected account. | ACME Inc. |
| Conversation ID | Unique conversation ID. | 658457CFBB27335CA16795F7E9BC57F1 |
| Conversation Topic | The name of the conversation automatically generated or changed by agents or supervisors. | Talking with Jason White |
| Customer Name | The name of the customer in this conversation. (applicable if the customer is added in the People module) | Jason White |
| Customer Contact | The contact of the customer. Depends on the channel of the conversation. |
CHAT-de0eeaf6-411c-411f-9ea0-bdd5652e7f3f-1610461852 |
| Agent Name | The agent's name is currently assigned to the conversation or was assigned to the conversation when the conversation was closed. | Philip Lee |
| Agent Username | The username the agent used to log into the web interface. | Plee04 |
| Conversation Status | The current status of the conversation. | Open |
| Conversation Priority | The current priority of the conversation. | Normal |
| Queue | The current queue the conversation is in. | Default Queue |
| Created At | The date and the time when the conversation was created. | 6/4/2020 12:04 |
| Year Created | The year when the conversation was created. | 2020 |
| Month Created | The month when the conversation was created. | 03 |
| Day of the Week Created | The day of the week when the conversation was created. | Sunday |
| Hour Created | The hour when the conversation was created. | 09:33 |
| Updated At | The date and the time when the conversation was updated the last time. | 1/2/2021 06:22 |
| Year Updated | The year when the conversation was updated | 2021 |
| Month Updated | The month when the conversation was updated. | 01 |
| Day of the Week Updated | The day of the week when the conversation was updated. | Sunday |
| Hour Updated | The hour when the conversation was updated. | 10:43 |
| First Assigned to an Agent At | The time when the conversation was assigned to the agent for the FIRST time. | 1/2/2021 06:18 |
| First Agent Response | The time when the agent sent the first message in the conversation. | 1/2/2021 06:19 |
| Channel Name | The name of the channel used in this conversation. | LIVE_CHAT |
| Total Messages | The total number of messages sent within the conversation. Includes both Private messages (notes) and Public messages (sent to, and from the customer). | 20 |
| Private Messages (notes) | The number of private messages or Notes sent within the conversation. They can be sent by, Agents, Supervisors or Automations. (notes are not visible to the customer). | 2 |
| Public Messages | The number of messages that were exchanged between the customer and the agent. Includes both inbound and outbound messages. | 18 |
| Public Messages (Inbound) | The number of messages that the customer sent. | 10 |
| Public Messages (Outbound) | The number of messages that agents, supervisors, or workflows sent. | 8 |
| Tags | The list of tags applied to the conversation. | VIP Customer, Forward |
| Summary | The summary of the conversation wrote by the agents or the supervisor. | 'The client was asking about his delayed delivery. Scheduled a call later until we get some info from the delivery service.' |
| Wait Time | The time elapsed from the moment the conversation was created until the agent sent the first message. Displays the time that the customer spent waiting for a response from the agent. |
1m 16s |
| Resolution Time | The time elapsed from creating the conversation until the agent marks the conversations as solved for the last time. Available only for closed conversations. |
16m 22s |
| Sentiment | The sentiment of the entire conversation. This evaluation only considers the messages that the customer sent (inbound messages). | 0.9 |
| Survey Score | The score that the customer left as part of the survey. | Happy |
| Sentiment Comment | The comment that the customer left along with the survey. |
'I really like how responsive this agent was while handling my issue.' |
| First response time SLA breach by |
Refers to the time for which a particular conversation has been breached. If the column is empty, it means the SLA has not been breached or it has not been counted for that conversation. |
2m 03s |
| Next reply time SLA breach by |
Refers to the time for which a particular conversation has been breached. If the column is empty, it means the SLA has not been breached or it has not been counted for that conversation. |
43s |
| Total resolution time SLA breach by |
Refers to the time for which a particular conversation has been breached. If the column is empty, it means the SLA has not been breached or it has not been counted for that conversation. |
23m 12s |
| Direction | Determines the direction of the conversations. Can be inbound or outbound. | Inbound |
| Senders | The list of senders that participated in the conversation grouped per channel. | APPLE_MESSAGES_FOR_BUSINESS (477fc0c7-0d83-4c17-8a7b-77b35b134a58), SMS (46130861334) |
| Handed over at |
The timestamp when the conversation assignment changed from bot to another value (e.g., "unassigned" or "Agent James"). If the event never occurred (conversation was never assigned to a bot), the timestamp will be empty (e.g. "-"). |
2021/11/25 16:11:09 or - |
Conversation Transcript
This is a special type of report in the form of a file that contains transcripts of all conversations that the selected agent handled.
Queues
The queues report provides the necessary information to determine the performance of each queue. Overall, this report helps supervisors or contact center managers to deduce how each queue is performing so they can make changes where required.
Also, they can track both the agents' and customers’ activity within every queue.
| Field | Description | Example |
|---|---|---|
| Account ID | Unique ID of the account. | 112233 |
| Account Name | The name of the selected account. |
ACME Inc. |
| Queue ID | The unique ID of the queue. | 6FD837D20260912DFC9C95EC87F7782 |
| Queue Name | A specific name of the queue. | Spanish Queue |
| Number of Assigned Agents | The number of agents currently assigned to the queue. | 13 |
| Assigned Agents | The list of agents currently assigned to the queue. | Mark Brown, Silvio Maroni, Philip Lee, Jess Moon |
| Number of Assigned Routes | The number of routes connected to that queue. | 2 |
| Assigned Routes | The list of routes currently assigned to that queue. | Route #100, Route #3870 |
| Created At | The date and time when the queue was created. | 10/29/2020 11:58:42 |
| Auto Assignment | Field showing if the auto assignment mechanism is enabled for this queue. | Yes |
| Old Conversations | The number of conversations that belong to this queue and were created before the selected report period but active during it. | 7 |
| New Conversations | The number of conversations that belong to this queue and were created within the selected report period. | 12 |
| Closed Conversations | The number of conversations that belong to this queue and were closed during the selected report period. Counts conversations closed by Agents, Workflows, or Waiting Strategy. | 66 |
| Closed by Agents | The number of conversations that agents closed. | 46 |
| Closed by Workflows | The number of conversations that were closed by workflows. | 14 |
| Closed by Waiting Strategy | The number of conversations that were closed by waiting strategy. | 6 |
| Unsolved Conversations | The number of conversations that belong to this queue and were active during the selected report period but were not closed during the selected period. | 27 |
| Median First Response Time | The median first response value of all conversations from this queue that were active during the selected period. | 2s |
| Median Resolution Time | The median resolution time of all conversations | 2m 32s |
| Median Sentiment | The median Sentiment of all conversations that were in that queue in the selected period. | 0.9 |
| Median Wait Time | The time from when the conversation was created until the agent sent the first message for all conversations that were in this queue in the selected period. | 54s |
| Median Private Messages (notes) | The median value of notes posted to conversations that belong to this queue. | 3 |
| Median Public Messages | The median value of public messages sent to a conversation (from this queue) count messages sent either by the customer or by the agent | 23 |
| Median Public Messages (Inbound) | The median number of messages sent to a conversation (from this queue) sent by customers | 10 |
| Median Public Messages (Outbound) | The median number of messages sent to a conversation (from this queue) sent by agents | 13 |
| First response time SLA breach | Shows the number of conversations that have breached this metric. | 2 |
| Next reply time SLA breach | Shows the number of conversations that have breached this metric. | 0 |
| Total resolution time breach | Shows the number of conversations that have breached this metric. | 3 |
Surveys
This report provides detailed insight into surveys that were submitted in the selected time period.
| Field | Description | Example |
|---|---|---|
| Account ID | Unique ID of the account. | 112233 |
| Account Name | The name of the selected account. | ACME Inc. |
| Conversation ID | The unique ID of the conversation. | 548457CFBB27335CA16795F7E9BC57F1 |
| Customer Name | The name of the customer who submitted the survey. Applicable only if the customer is added to the People module. | Jason Smith |
| Customer’s Contact | The contact the customer used to submit the survey. | 421948232829 |
| Channel | The channel over which the survey was submitted. | |
| Agent | The agent who was handling the conversation at the time when the survey was submitted. | Veronica Quinn |
| Survey | A specific name of the survey. | CSAT Survey |
| Score | The score that the customer left when submitting the survey. | Happy |
| Comment | The comment that the customer posted in addition to the score. (Optional) | 'I really loved the velocity at which Veronica handled my request.' |
| Surveyed Date |
The date and time when the survey was submitted.
|
10/29/2020 11:58:42 |
Channels
This report contains important information about the data that is relevant for each channel. The data provided in this report helps you delve into the performance of each channel utilized by the contact center.
All channels use the same metrics, except for the metrics specific for the Calls channel- highlighted in bold.
| Field | Description | Example |
|---|---|---|
| Account ID | Unique ID of the account. | 112233 |
| Account Name | The name of the selected account. | ACME Inc. |
| Chanel Name | The name of the channel used to pull this report. | |
| Sent Messages | The number of messages sent within the selected period. | 51 |
| Received Messages | The number of messages received within the selected period, i.e., the number of messages sent by customers. | 44 |
| Old Conversations | The number of conversations from the selected channel that were created before the selected report period. | 17 |
| New Conversations | The number of conversations from the selected channel that were created during the selected report period. | 41 |
| Closed Conversations | The number of conversations from the selected channel that were closed during the selected report period. | 80 |
| Closed by Agents |
The number of conversations from the selected channel that were closed by agents during the selected report period. |
55 |
| Closed by Workflows | The number of conversations from the selected channel that were closed by workflows during the selected report period. | 5 |
| Closed by Waiting Strategy |
The number of conversations from the selected channel that were closed by a waiting strategy during the selected report period. |
20 |
| Unsolved Conversations | The number of active conversations in the selected channel that weren't closed during the selected period. | 7 |
| First Response Time | Median first response time of all conversations from the selected channel in the chosen report period. | 2s |
| Sentiment | Median sentiment of all closed conversations from the selected channel in the chosen report period. | 0.9 |
| Assigned Calls |
The total number of calls that were assigned to all agents in the selected period. Different from 'New Conversations' since a new conversation can be abandoned, whereas assigned calls include only those that were assigned to an agent. |
134 |
| Accepted Calls | The total number of calls that all agents accepted agents in the selected period. | 77 |
| Total Call Duration | The total duration of all calls in the selected period. | 2h 32m 07s |
| Unanswered Calls | The total number of calls assigned to the agents but agents didn't answer. | 4 |
| Rejected calls |
The total number of calls that were rejected by all agents in the selected time period. The call was assigned to the agent (and it was ringing) but they decided to reject it. |
6 |
| Wait Time |
The median time that the user is waiting for the agent's response. Counts as the time when the call starts until it is accepted by the agent. |
5s |
| Transferred Calls | The number of calls that were transferred in the selected period. | 11 |
| Expired Calls |
The number of calls that were disconnected because of a timeout. The maximum wait time has passed and the call was terminated. |
4 |
| Abandoned Calls |
The number of calls that were abandoned by the customers. *Refers to calls the customers hung up before they were connected to an agent. |
13 |
| Dropped Calls | The number of calls that were disconnected because of some technical issues. | 2 |
Tags
This report provides important insights into conversations that have certain tags added. Since tags describe specific topics, this data help supervisors determine how certain topics are handled within their contact center.
| Field | Description | Example |
|---|---|---|
| Account ID | Unique ID of the account. | 112233 |
| Account Name | The name of the selected account. | ACME Inc. |
| Tag ID | The unique ID of the tag. | 6DB7FBE9BA6555D31F078281BE42827D |
| Tag Name | The specific name created for this tag. | Important |
| Created At | The date and time when the tag was created. | 03/04/2020 13:08:38 |
| Last Updated At | The date and time when the tag was last updated. | 03/04/2020 13:22:45 |
| Closed Conversations | The number of conversations containing this tag that were closed within the selected period. | 23 |
| Waiting Time | The time elapsed from when the customer sent the first message until the agent replied. | 1m 22s |
| Resolution Time | Median resolution time for all conversations containing this tag within the selected period. | 3m 23s |
Agents
Agents report consists of 3 parts:
- General information which contains data in the table below
- Agent utilization
- Agent performance
The report will only contain the data that you selected when creating the report.
| Field | Description | Example |
|---|---|---|
| Account ID | Unique ID of the account. | 112233 |
| Account Name | The name of the selected account. | ACME Inc. |
| Agent ID | Unique ID of the agent. | 4EE921EBE72C99F6262D59FE856696B7 |
| Agent Name | Agent's Name. | Veronica Quinn |
| Number of Assigned Queues | The number of queues that this agent is assigned to. | 12 |
| Assigned Queues | The list of queues that this agent is assigned to. | Queue #5062, Queue #5297, German Queue, VIP_Customers |
| Capacity | The capacity per channel category that this agent has configured. |
EMAIL = 5, LIVE_MESSAGING = 10, LIVE_CHAT = 9 |
Agent Utilization
This report shows how agents are using their time while being logged in the system.
| Field | Description | Example |
|---|---|---|
| Logged In Time | The time that the agent spent logged in in the selected period. |
11h 39m |
| Available Time | The time agent spent in the Available group of statuses | 5h 11m |
| Available | The time spent in the Available status. | 3h 52m |
| Idle | The time spent in the Idle status. | 13m |
| Under capacity | The time spent in the Under Capacity status. | 30m |
| Away Time | The time agent spent in the Away group of statuses. | 1h |
| Away | The time agent spent in the Away status. | 30m |
| *Set of custom Away statuses | The time spent in each custom Away status. | 10m |
| Busy Time | The time agent spent in the Busy group of statuses. | 1h 25m |
| Busy | The time agent sent in the Busy status. | 19m |
| Full Capacity | The time spent in the Full Capacity status. | 30m |
| In a Call | The time spent in the In a Call status. | 30m |
| Ringing |
The time spent in the Ringing status. |
3m |
| Wrap-Up |
The time spent in the Wrap-Up status. |
3m |
| *Set of custom Busy statuses | Time spent in each custom Busy status. | 30m |
| Engaged Time | The time that the agent has spent in statuses that are considered as engaging with the customer (Under capacity, Full, Ringing, In a Call, Wrap-Up). |
5h 24m |
| Engaged Rate | The percentage of the engaged time during logged-in time. |
11.09% |
Bear in mind that this report is dynamic, meaning that its columns depend on the number of custom statuses configured for the account. Each custom status is tracked as well.
Agent Performance
This report provides more info regarding agents' performance while communicating with customers.
| Field | Description | Example |
|---|---|---|
| Closed Conversations | The number of conversations the agent closed in the selected period. | 112 |
| Conversations Assigned to Other Agents | The number of conversations that this agent assigned to other agents. | 11 |
| Conversations Assigned From Other Agents | The number of conversations that other agents assigned to this agent. | 45 |
| First Response Time | The median value of the first response time (the first message sent) for all conversations that this agent sent in the selected period. | 1m 44s |
| Handling Time | The median value of the time elapsed from the moment the conversation was assigned to the agent until they CLOSED it for the last time. | 55m 12s |
| Sentiment | The median sentiment value for all conversations handled by this agent in the selected period. | 0.74 |
| Closed Conversations per Login Hour | The number of conversations closed per login hour. | 15.6 |
|
Private Messages (Notes) |
The number of private messages (notes) that this agent posted. |
1 |
|
Public Messages (Outbound) |
The number of public messages (outbound) that this agent sent. |
10 |
|
Private Messages per Conversation |
The number of private messages (notes) divided by the number of total conversations that this agent handled. |
1.4 |
|
Public Messages per Conversation |
The number of public messages divided by the number of total conversations that this agent handled. |
6.89 |
| Assigned Calls |
The number of calls assigned to this agent. (The agent had a ringing screen presented to them). |
90 |
| Accepted Calls | The number of calls that the agent accepted. | 80 |
| Call Duration | The median duration of the calls that this agent answered. | 17m |
| Unanswered Calls |
The number of calls unanswered by this agent. (The agent was presented with the ringing screen but didn’t answer or pick up the call). |
7 |
| Rejected Calls |
The total number of calls that were rejected by all agents in the selected time period. The call was assigned to the agent (and it was ringing) but they decided to reject it. |
6 |
| Transferred Calls | The number of calls that this agent transferred to another agent. | 18 |
| Wait Time | The time that the customer was waiting for an agent to pick up the call. | 1m 14s |
| Expired Calls | The calls that were dropped due to a waiting strategy time out. | 4 |
| Abandoned Calls |
The number of calls that were abandoned by the customers. *Refers to calls the customers hung up before they were connected to an agent. |
1 |
| Dropped Calls | The number of calls that were disconnected because of some technical issues. | 0 |
Agent Status Logs
This report provides crucial information for managers such as when the agents come into work, duration spent in a certain status, when they change their status to Busy, Away, or Available.
Conversations Analytics Managers can understand how their agents are utilizing their time, and at which point in time, they have changed something in conversations. In conclusion, this report will help them perform a more precise evaluation of their agents.
| Field | Description | Example |
|---|---|---|
| Account ID | Unique ID of the account. | 1122333 |
| Account Name | The name of the selected account. | ACME Inc. |
| Agent ID | Unique ID of the agent handling the conversation. | 4EE921EBE733D9F6262D59FE856696B7 |
| Agent Name | Agent's full name. | Fabricio Silco |
| Status ID | Unique ID of the status. | 73bc600e-6e98-11ea-a2fb-02c9afa9ebec |
| Status | The name of the agent status related to the Status ID. This is reflected throughout Conversations. | Offline |
| Start Time | The timestamp when the agent changed their status to the given status. | 2021/11/24 08:37:38 |
| End Time | The timestamp when the agent changed their status to a different one. Or if the status was changed automatically. | 2021/11/24 10:32:48 |
| Duration | The duration the agent spent in the given status. | 01:55:10
|