Incident status
The Infobip Incident Status page contains information about ongoing and past incidents that occurred on the Infobip platform and affected Infobip products and services.
Also, this page shows information about active or incoming regular and emergency maintenances that may affect certain service performance.
NOTE
The Infobip incident status page no longer contains info regarding the certificate renewal process. To find out more, check out the SSL certificate renewal section.
NOTE
"Network delivery degradations" and "planned operator maintenance" information is not available on the Infobip Status page.
DISCLAIMER
The status page itself is a solution developed by a third party. If you have any questions or concerns about the integration efforts, please note that Infobip Support cannot offer any immediate assistance. We recommend that you use the original Status page where you will find documentation and integration manuals.
Regions & services
The Status page is divided into 5 regions:
- EMEA (Europe, Middle East, and Africa)
- AMERICAS (NAM) - (North America)
- AMERICAS (LATAM) - (South America)
- APAC (Asia - Pacific)
- INDIA
Regions are then divided by service layers as follows:
- Applications – Refers to all applications and services that you can use via the Infobip web interface.
If the region doesn’t have the web interface hosted in one of its locations, then the application part will not be listed for that region. - Channels – Represents communication channels available in the region.
Note that some communication channels are grouped together (if available in the region). - Interface/API – Represents the connection points of Infobip Data Centers where request/traffic is submitted. Each region has different data centers, and therefore, different connection points which you can see under the additional description (question mark icon).
If there is an incident listed, the name of the data center will also be shared, considering that a single region can have multiple locations/data centers.
Get support and subscribe to updates
Depending on your region and the Infobip services you may be using, you can subscribe to certain (or all) components in each region.
You will find several subscription options on the Status page:
- Email notifications
- Slack notifications
- Webhook URL integration
- Notifications via Atom or RSS feed
e.g., If you subscribe to email notifications, once you enter your email address, you will be able to select the components/Infobip services that you are using. After that, you will receive a confirmation email.
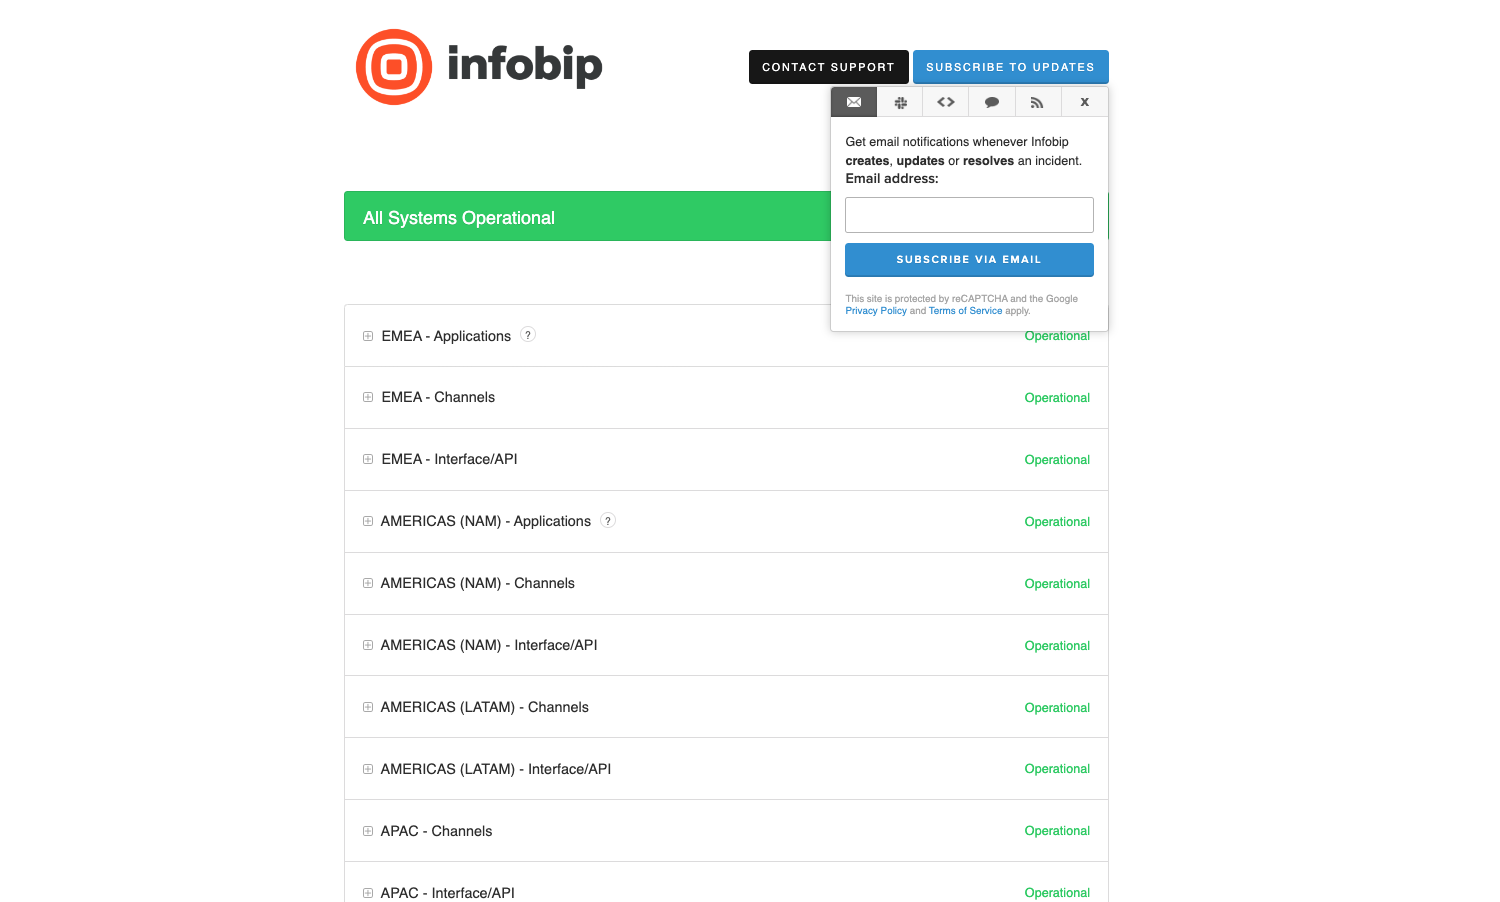
If you want to report an issue with a certain service, or if you cannot find any active incident related to your issue on the Status page, you can use the Contact Support button which will open a ticket with Infobip support.
Which components should I subscribe to?
We recommend that you subscribe to the region and services that you are using or that are important to you.
Here are a few examples to that can help you:
- If you submit SMS messages to the Indonesia Data Center, you should subscribe to the HTTP API interface and SMS channel under the APAC region.
- If you connect to the EMEA-based web interface, you should subscribe to the "Customer Portal Login/Homepage" component, as well as all other Infobip UI services you might be using under the EMEA region.
- If you submit your SMS traffic toward US Data Centers, you should select the SMPP component under the AMERICAS (NAM) region.
- If you use WhatsApp for Business in India, subscribe to the WhatsApp channel listed under the INDIA region component.
Note that it is possible that in some cases you will not be connecting to a data center in your region. We recommend checking the endpoints listed on the Status page or contacting your account manager if you are unsure that you are connecting to the proper component/region.
How is an active incident represented?
An active incident or maintenance will always be displayed at the top of the page, just above the regions and services section.
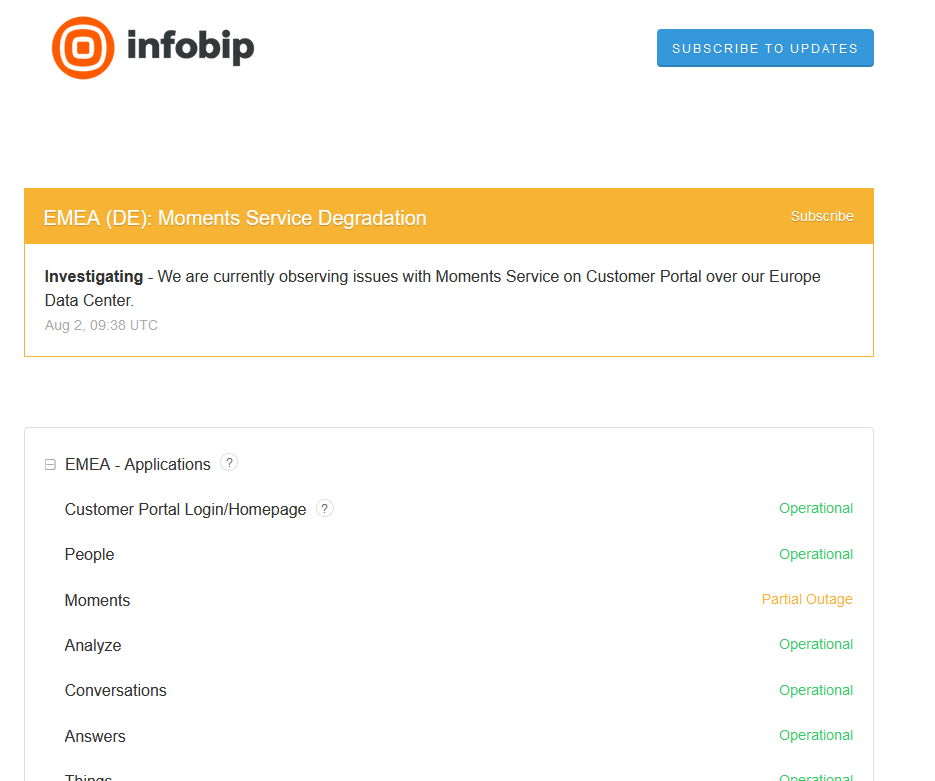
The incident post usually contains a subject with the affected region/service and the corresponding status: Investigating, Identified, Monitoring, Resolved.
Also, the affected component will change its status (and color) in the corresponding region. In the above example, that would be EMEA region > Applications > Moments → Partial Outage.
You can check out different types of incident statuses in the table below:
| Incident status | Description |
|---|---|
| Investigating | Infobip staff/monitoring services have detected the issue, and it is under investigation. |
| Identified | We have identified the root cause of the issue, and are working toward a solution. |
| Monitoring | Observing service performance after adjustments have been made. |
| Resolved | We have resolved the issue, and the service is operational. |
Also, each component will have an applicable incident status, distinguishable by color:
| Component status | Color |
|---|---|
| Operational | Green |
| Degraded performance/Partial outage | Yellow |
| Major outage | Red |
| Under maintenance | Blue |
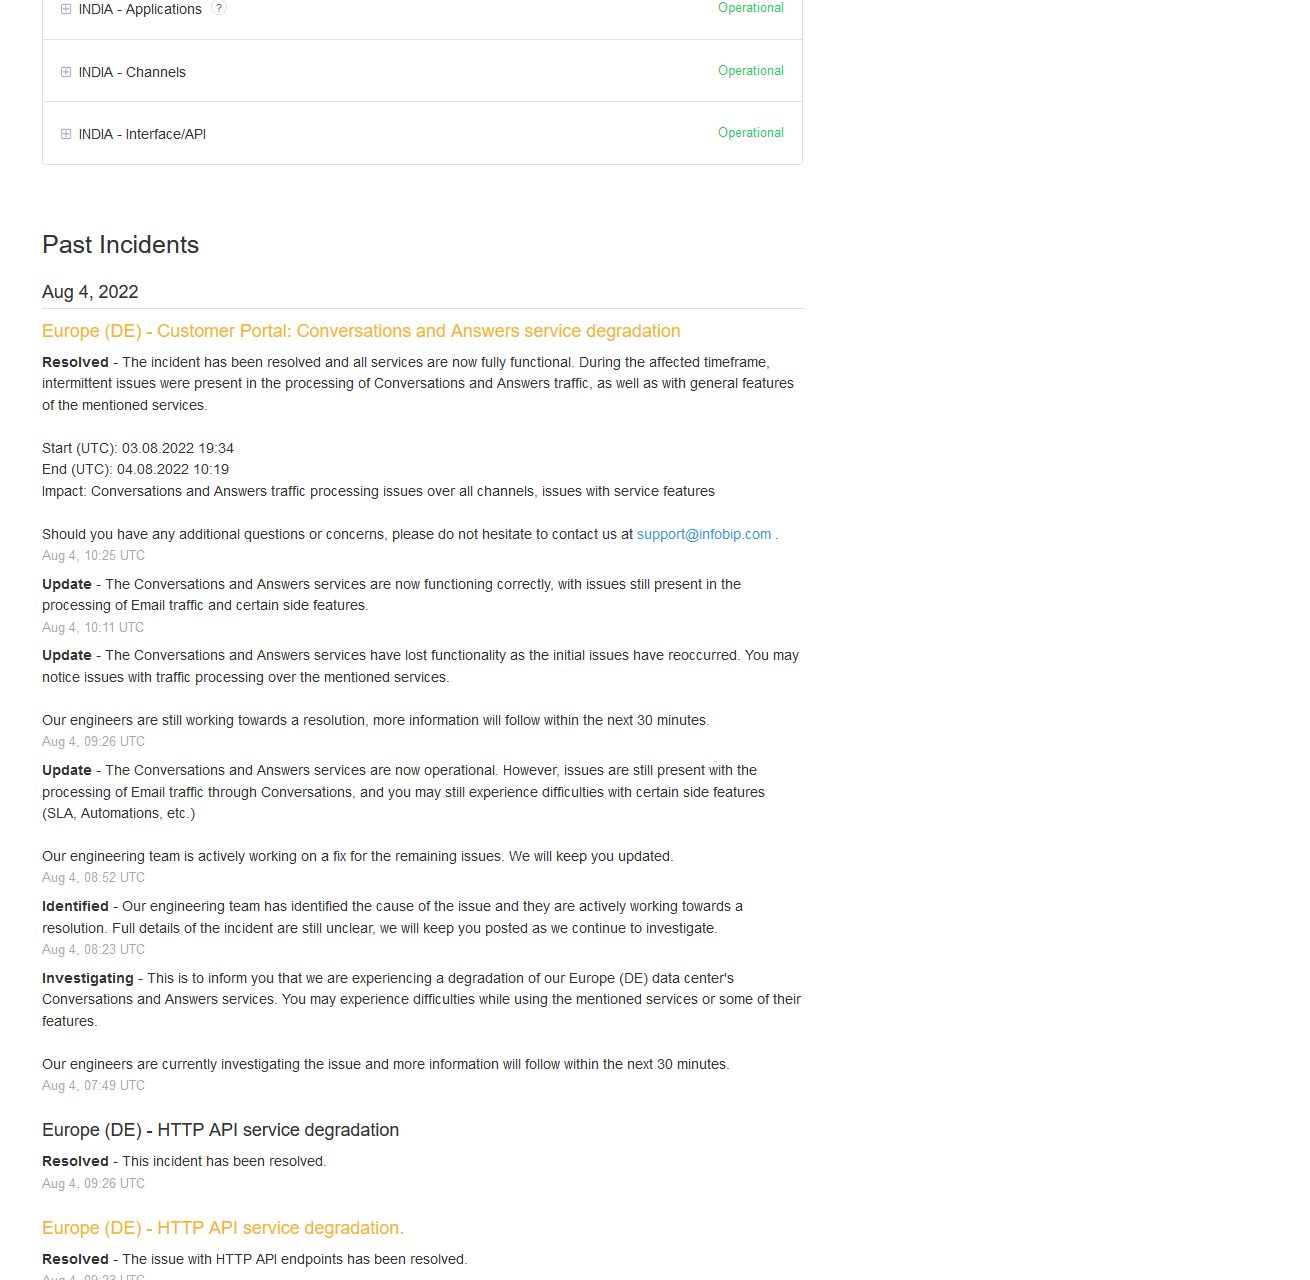
Previous incidents and maintenance
All previous incidents and maintenance are listed below the Regions and Services section in chronological order, from latest to oldest.
You will see additional information (incident impact) about each incident. Simply hover over and click on any incident subject on the list.
Furthermore, you can also view the incident history located at the bottom left corner of the page.